
Linear regression is one of the most fundamental algorithms in machine learning. It models the relationship between a dependent variable y and a single independent variable x.
In this example, we aim to predict the price of a flat (in dollars) based on its size in square meters.
Model Representation
The mathematical model for linear regression with one variable is:

Where:
: Input feature (e.g., size in square meters)
: Output/target variable (e.g., price in dollars)
: Intercept (value of
when
)
: Slope of the line (how much
)
Training Data and Notation
In supervised learning, we train the model using labeled examples. A training set consists of multiple examples of inputs and their corresponding outputs.
Let:
: Total number of training examples
: A single training example, where
: The
th training example in the dataset, where

Example Dataset
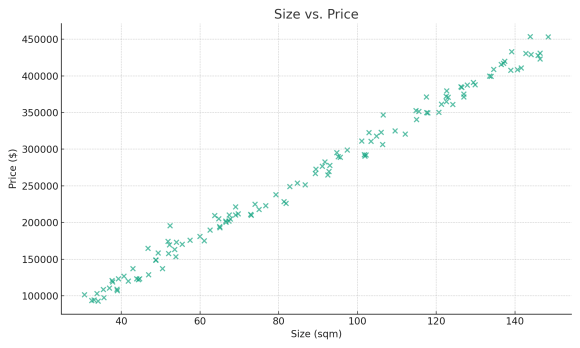
We created a sample dataset of 120 observations. Each data point represents a flat with a given size (between 30 and 150 square meters) and its corresponding price. The prices include random variation to simulate real-world conditions.
Sample of the Data:
Size (sqm)     Price ($)
74.94          217,813.91
144.08         428,980.53
117.84         349,596.74
101.84         290,881.90
48.72          149,127.91
Visualization
Below is a scatter plot showing the relationship between size and price. The pattern clearly suggests a linear trend, which makes linear regression a suitable approach for modeling this data.
Goal of Linear Regression
The objective of linear regression is to find the line that best fits the training data—minimizing the error between the actual outputs and the values predicted by the model.
In future posts, we'll explore how to estimate the parameters 

