Markets & economy · Cenk Ufuk Yildiran · Research cut-off: 27 October 2026 (US market close)
The central question is not whether AI attracted money, but where that investment flowed—and whether the firms supplying the infrastructure subsequently outperformed the broader market. From the public launch of ChatGPT in November 2022 to the expansion of hyperscaler data centres in 2025–26, the story has shifted from a narrow enthusiasm for accelerated computing towards a more complex physical investment cycle. Semiconductor demand still matters, but data centres also require networks, electrical infrastructure, cooling, construction and electricity.
This article separates three propositions that are often blurred together: (1) hyperscalers increased their capital expenditure; (2) certain businesses are economically exposed to that spending; and (3) shares in those businesses delivered excess returns. Company reports can establish the first; industry structure helps investigate the second; only a reproducible return comparison can assess the third. Even then, stock returns by themselves do not establish causation.
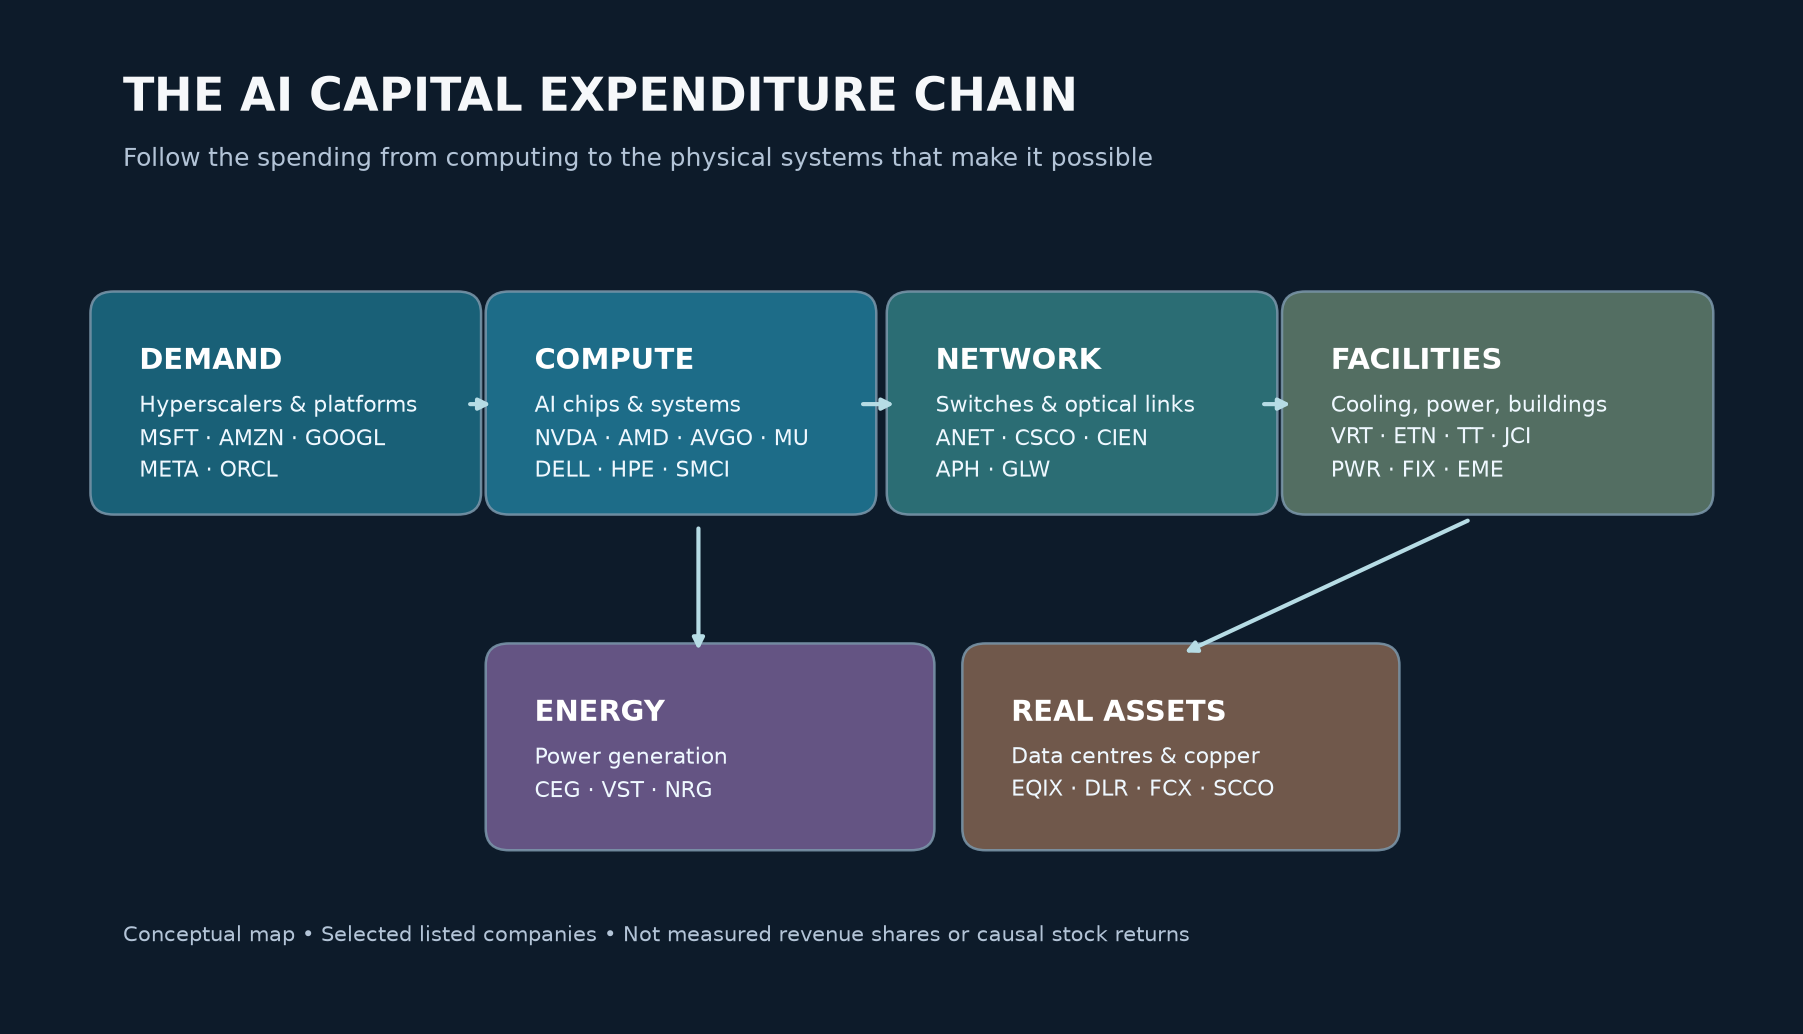
Figure 1. The physical transmission of AI infrastructure investment. This is a conceptual illustration, not a quantified allocation of expenditure or proof of stock-market causation.
1. One AI cycle, several different market phases
The chronology creates a useful natural research design. OpenAI introduced ChatGPT on 30 November 2022. The date marks the public arrival of a new wave of generative-AI attention, but it is not the date on which the underlying field or the AI hardware industry began. On 24 May 2023, Nvidia reported $4.28 billion of data-centre revenue and guided to approximately $11 billion of revenue for the following quarter. That announcement made the immediate commercial demand for accelerated computing considerably harder to dismiss.
A third shift emerged during 2024 and became more pronounced in 2025–26: the market began to focus on the infrastructure required to deploy ever-larger computing systems. The economic chain extends beyond GPU vendors to networking suppliers, power-distribution specialists, air-conditioning and liquid-cooling systems, construction contractors, electricity generators and real-estate operators. It is misleading to claim that this infrastructure phase began abruptly on 1 January 2025; that date is a convenient measurement boundary, not a causal event.
| Research period | First included trading session | Base close | Final close | What we are testing |
|---|---|---|---|---|
| Pre-generative-AI baseline | 2 Jan 2020 | 31 Dec 2019 | 31 Oct 2022 | Was a business already outperforming before the AI narrative? |
| Initial AI repricing | 1 Nov 2022 | 31 Oct 2022 | 23 May 2023 | Did the early generative-AI narrative change relative returns? |
| Post-Nvidia guidance | 24 May 2023 | 23 May 2023 | 31 Dec 2024 | Was leadership concentrated in accelerated-computing suppliers? |
| Mature infrastructure/CapEx phase | 2 Jan 2025 | 31 Dec 2024 | 27 Oct 2026 | Did leadership broaden into physical infrastructure? |
All returns below use base-close-to-end-close measurements. This avoids inadvertently omitting the return on the first session of a named period. We also report calendar-year 2024, 2025, and 2026 year-to-date, and cumulative windows starting at the end of October 2022 and December 2023. The latest end date is deliberately frozen at 27 October 2026 rather than relying on an intraday quote. Nvidia’s 24 May 2023 earnings release occurred after the US cash-market close. Our broad regime convention uses the 23 May base close, and therefore includes the pre-announcement 24 May session; the separate CSV robustness window uses the 24 May base close to start with the first full reaction session, 25 May. The broad regime split should not be mistaken for a clean one-day announcement event study.
2. Capital spending: what company accounts actually establish
The public disclosures are striking. In its FY2026 annual report, Microsoft reported $115.95 billion of cash additions to property and equipment, compared with $64.55 billion in FY2025 and $44.48 billion in FY2024. It explicitly tied continuing expenditure to cloud growth, AI training and associated infrastructure. These are Microsoft’s fiscal years ending in June, not calendar-year spending figures.
Amazon’s full-year 2025 results reported $128.3 billion in net purchases of property and equipment (under the company’s stated definition), compared with around $77.7 billion in 2024. Its stated approximately $200 billion of expected 2026 capital expenditure also covers investments outside AI, including robotics, proprietary chips and satellite-related initiatives. Alphabet’s 2025 annual filing reported approximately $91.4 billion of 2025 capital spending, while its July 2026 quarterly filing described $80.6 billion in the first six months of 2026, versus $39.6 billion a year earlier.
Meta reported $72.22 billion of 2025 capital expenditure including finance-lease principal. Its October 2026 third-quarter results narrowed the expected full-year 2026 capital expenditure range to $135–145 billion, including principal payments on finance leases. Oracle’s FY2026 results showed rapidly rising cloud-infrastructure investment, with trailing-four-quarter capital expenditure around $55.7 billion.
| Company | Disclosed annual amount, USD bn | Reporting basis | What the figure does not mean |
|---|---|---|---|
| Microsoft | 115.95 | FY2026 cash additions to property and equipment | Not exclusively AI; fiscal year ends in June |
| Amazon | 128.3 | CY2025 purchases of property and equipment, net of specified sales/incentives | Not exclusively AWS or AI |
| Alphabet | 91.4 | CY2025 capital expenditure | Includes non-AI assets and facilities |
| Meta | 72.22 | CY2025 capital expenditure including finance-lease principal | Not directly comparable with cash-PPE-only measures |
| Oracle | 55.7 | Trailing four quarters to FY2026 Q4 | Different fiscal window and financing presentation |
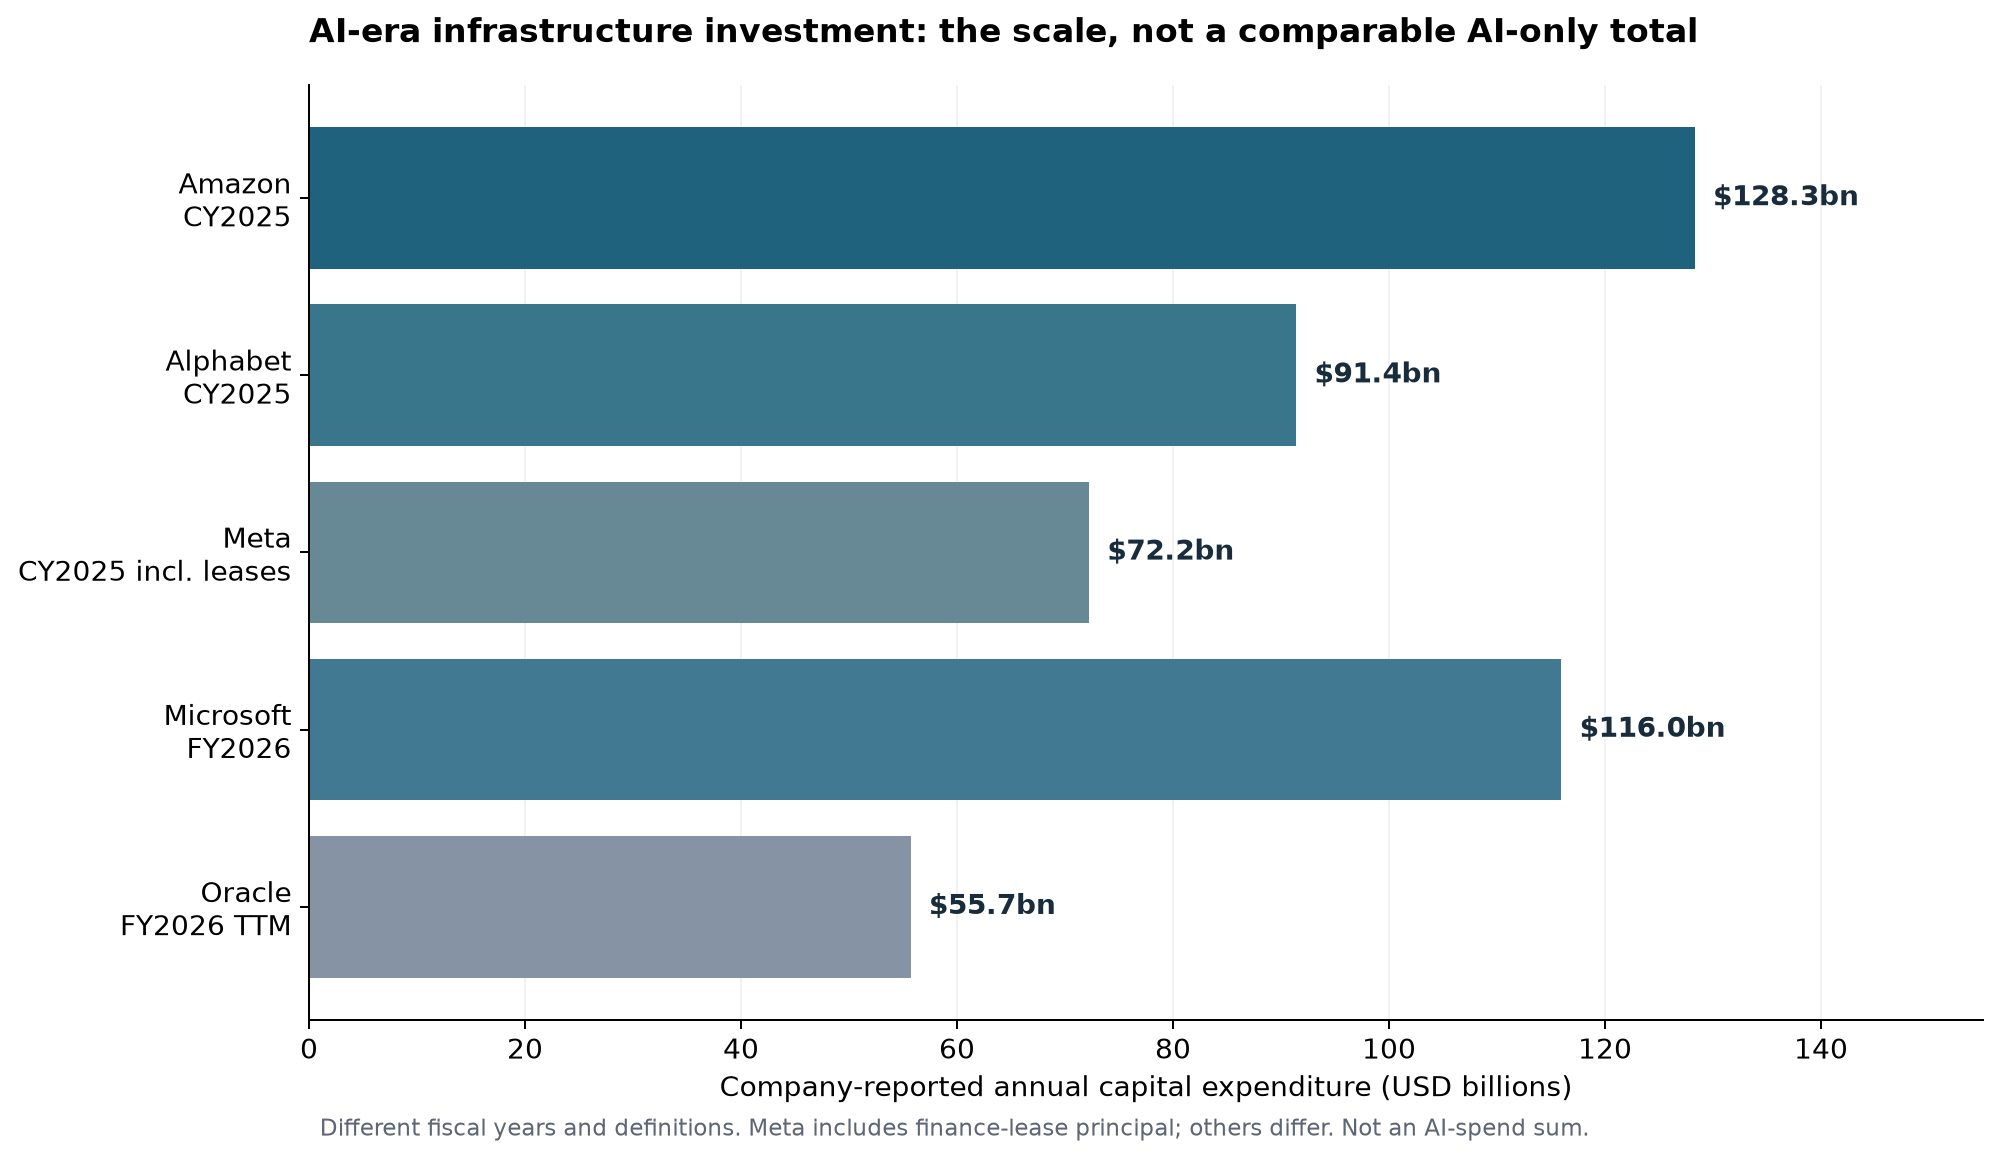
Figure 2. Selected reported annual spending amounts. The bars are not a homogeneous measure of AI spending and should neither be summed nor interpreted as directly comparable cloud-infrastructure budgets. Microsoft’s fiscal year and Oracle’s trailing reporting window differ from calendar-year figures; Meta’s figure includes finance-lease principal.
Two further cautions matter. First, company CapEx is not synonymous with AI CapEx: cloud capacity for conventional workloads, offices, logistics and other business lines can enter the accounting numbers. Second, spending is not a realised profit. An AI infrastructure investment becomes an attractive economic investment only if future utilisation, pricing and operating margins justify the cost of capital.
3. Why electricity, cooling and construction belong in an AI study
A modern data centre has to be wired, cooled and powered continuously. High-performance computing raises power density and increases the importance of electrical distribution, uninterruptible power systems and heat removal. New sites require engineering and construction; additional demand for electricity may necessitate new generation, transmission equipment and grid connections.
The International Energy Agency’s Energy and AI report estimated that data centres consumed around 415 TWh of electricity in 2024, roughly 1.5% of global electricity consumption, and projected approximately 945 TWh by 2030 in its base case. Its separate supply-side accounting projects electricity generation supplying data centres to rise from about 460 TWh in 2024 to over 1,000 TWh in 2030. Those are related but different definitions and should not be conflated.
This does not establish that every utility—or every supplier of copper, HVAC or switchgear—is an AI beneficiary. It does establish a plausible physical mechanism for investigating those industries. A company may derive only a modest share of revenue from AI-oriented projects, and its share price may be dominated by rates, commodity prices, regulation or unrelated end-markets. The question is whether the return data support the proposed broadening after accounting for the parent sector.
4. Following the supply chain through GICS sub-industries
The Global Industry Classification Standard (GICS), maintained by MSCI and S&P Dow Jones Indices, provides a common taxonomy. Below are selected research baskets, not comprehensive or official GICS sub-industry indices. Their composition is intentionally explicit, so a reader can see how selection affects the results.
| Research basket / GICS sub-industry | Illustrative listed firms (tickers) | Principal possible transmission channel |
|---|---|---|
| Semiconductors | NVDA, AMD, AVGO, MU | Accelerators, networking silicon and high-bandwidth memory |
| Semiconductor Materials & Equipment | AMAT, LRCX, KLAC | Wafer-fabrication tools and process equipment |
| Communications Equipment | ANET, CSCO, CIEN | High-speed switching, routing and optical networking |
| Technology Hardware, Storage & Peripherals | DELL, HPE, SMCI | AI servers, storage and systems integration |
| Electronic Components | APH, GLW | Connectors and optical components |
| Electrical Components & Equipment | VRT, ETN, HUBB, POWL, NVT | Power distribution, UPS and electrical infrastructure |
| Construction & Engineering | PWR, FIX, EME, MTZ | Building services, power infrastructure and site construction |
| Building Products | TT, JCI | Thermal management and building systems |
| Independent Power Producers & Energy Traders | CEG, VST, NRG | Generation capacity and electricity demand |
| Data Center REITs | EQIX, DLR | Data-centre real estate and interconnection |
| Copper | FCX, SCCO | Materials used in electrical infrastructure |
Classification audit: The eleven sub-industry labels and codes have been cross-checked against the published GICS taxonomy, but the 33 selected securities have not been independently matched to licensed, point-in-time company classifications. These are GICS-labelled, thematically selected research baskets, not official historical GICS portfolios. GICS underwent structural changes in March 2023, notably splitting Specialized REITs into more granular categories including Data Center REITs. A category name used in the 2025 taxonomy should not be mechanically projected back to 2020. See MSCI’s GICS framework and S&P DJI’s 2023 classification-change discussion. Historical membership remains not verified.
Importantly, the companies making the expenditure are a different population from those selling equipment and services to the spenders. Microsoft, Amazon, Alphabet, Meta and Oracle appear in a separate demand-side comparison rather than being mixed indiscriminately into the supplier baskets.
5. How we measure the stock-market evidence
The analysis tests all eleven GICS sectors using SPDR sector ETF proxies: XLC, XLY, XLP, XLE, XLF, XLV, XLI, XLK, XLB, XLRE and XLU. SPY serves as the investable US large-cap market benchmark. For each selected sub-industry we calculate the simple return of a buy-and-hold, equal-dollar portfolio, re-established independently at the start of each window. We also report each individual stock. Sector ETFs are proxies, and these baskets are not official MSCI/S&P GICS index series.
Returns use adjusted closing prices and are quoted in US dollars, before investor fees, taxes and execution costs. The adjusted-price series is intended as a practical proxy for dividends-reinvested total return. We compute a cumulative return as:
To identify stock-selection rather than simply a bull market, the key comparison is geometric excess wealth against SPY and the relevant parent-sector ETF:
A +40% return in a stock does not itself demonstrate AI-specific leadership if its sector returned +50% over the same interval. Similarly, the ranking of a hand-picked basket should not be presented as a market-wide industry effect.
Calculated results: dated 27 October 2026
All numeric returns in this section were generated by the linked Python script from a single snapshot of Yahoo Finance adjusted closing prices. These are price-series total-return proxies, not licensed index returns or causal estimates.
The three strongest sector ETF proxies in the measured 2025–26 CapEx window were Energy (+67.8%), Information Technology (+64.6%), Health Care (+34.2%). This ranking is descriptive; a selected theme does not explain all movements in these diversified sector portfolios.
All eleven sector ETF proxies: cumulative returns
| sector | Baseline | Early AI | Compute | CapEx |
|---|---|---|---|---|
| Communication Services | -8.0% | +27.6% | +61.0% | +9.3% |
| Consumer Discretionary | +17.5% | +4.5% | +52.0% | +4.5% |
| Consumer Staples | +24.0% | +3.3% | +11.2% | +16.1% |
| Energy | +72.7% | -9.1% | +13.3% | +67.8% |
| Financials | +16.9% | -3.9% | +54.2% | +18.7% |
| Health Care | +36.1% | -1.3% | +8.9% | +34.2% |
| Industrials | +21.2% | +5.4% | +37.5% | +30.2% |
| Information Technology | +43.3% | +22.2% | +51.6% | +64.6% |
| Materials | +27.6% | +5.1% | +13.1% | +27.1% |
| Real Estate | +3.6% | -0.2% | +20.3% | +10.5% |
| Utilities | +12.8% | +0.2% | +21.6% | +18.9% |
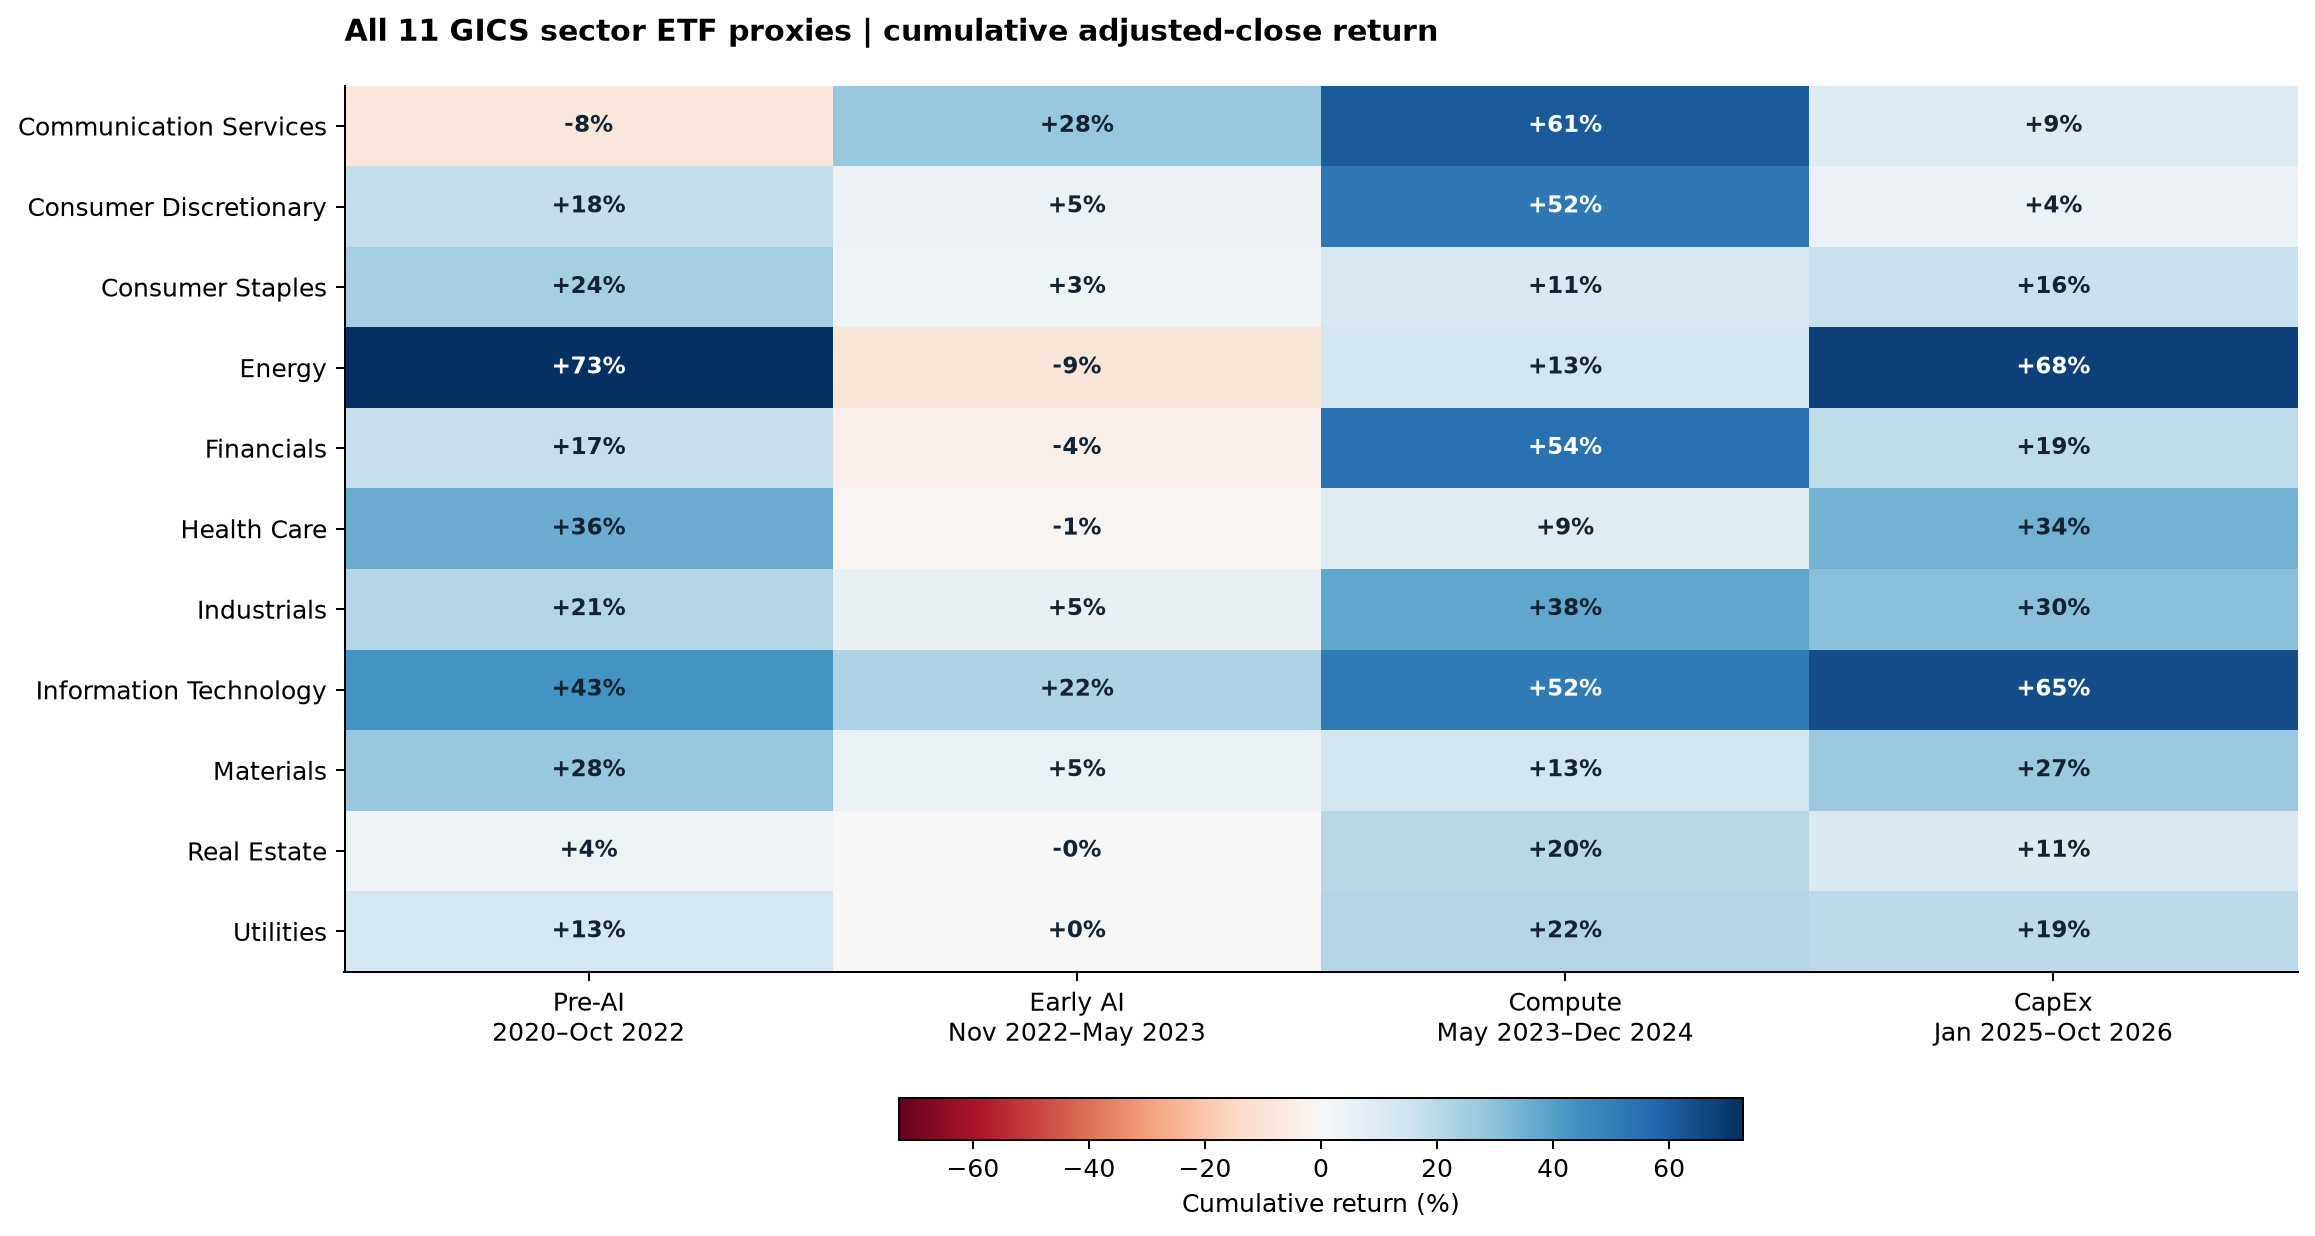
Figure 3. All 11 investable sector ETF proxies. Green/red shading and values represent cumulative adjusted-close returns, not official GICS index returns.
Eleven selected sub-industry baskets: cumulative returns
| Selected GICS sub-industry basket | Baseline | Early AI | Compute | CapEx |
|---|---|---|---|---|
| Semiconductors | +56.6% | +69.6% | +156.4% | +371.1% |
| Semiconductor Materials & Equipment | +58.9% | +38.9% | +38.3% | +177.0% |
| Communications Equipment | +51.3% | +6.9% | +109.3% | +159.9% |
| Technology Hardware, Storage & Peripherals | +80.1% | +52.6% | +99.9% | +186.5% |
| Electronic Components | +31.7% | -1.9% | +76.2% | +150.2% |
| Electrical Components & Equipment | +35.9% | +41.3% | +219.7% | +65.7% |
| Construction & Engineering | +122.6% | +19.7% | +125.1% | +91.5% |
| Building Products | +56.7% | +7.2% | +78.6% | +63.7% |
| Independent Power Producers & Energy Traders | +16.3% | -7.9% | +275.4% | +10.8% |
| Data Center REITs | -3.4% | +8.5% | +74.0% | +8.1% |
| Copper | +87.5% | +28.7% | +28.5% | +106.9% |
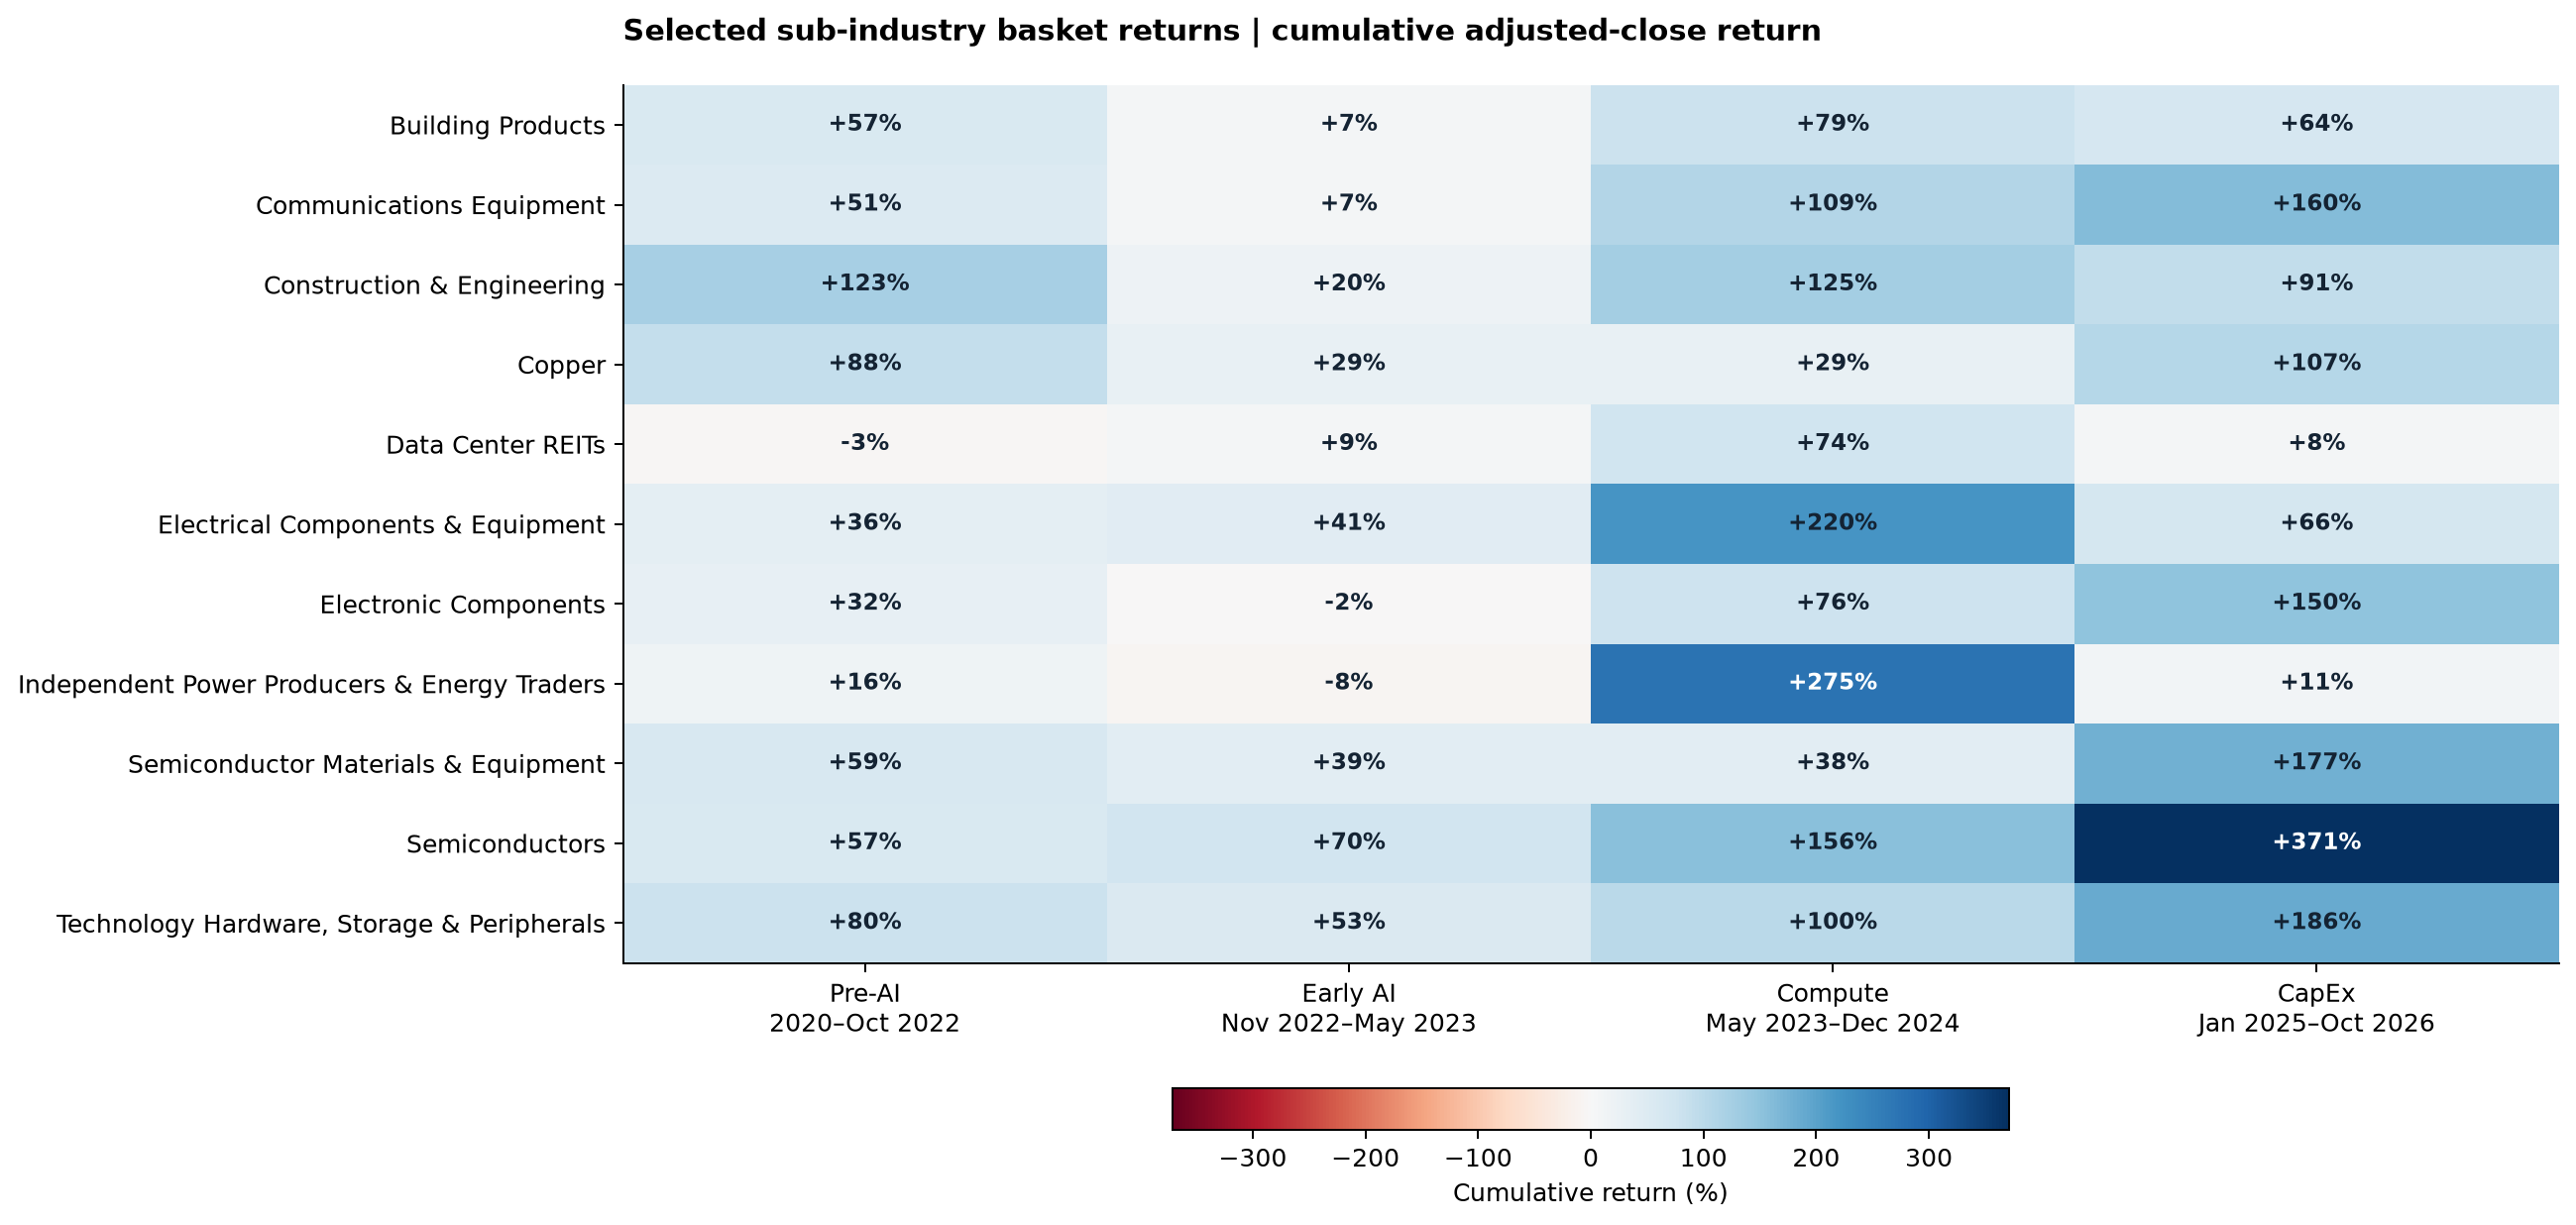
Figure 4. Equal-dollar buy-and-hold baskets, reset independently at each period’s beginning. A basket is not an official GICS index; its stock coverage can differ across historical periods.
Relative performance in the CapEx phase
This table compares each custom sub-industry basket with both the broad market and its own parent-sector ETF. The latter controls descriptively for sector direction, not for individual risk factors or changing industry exposure.
| Selected sub-industry basket | Return | Vs SPY | Vs parent sector | Coverage |
|---|---|---|---|---|
| Semiconductors | +371.1% | +251.8% | +186.2% | 4/4 names |
| Technology Hardware, Storage & Peripherals | +186.5% | +113.9% | +74.1% | 3/3 names |
| Semiconductor Materials & Equipment | +177.0% | +106.9% | +68.3% | 3/3 names |
| Communications Equipment | +159.9% | +94.1% | +57.9% | 3/3 names |
| Electronic Components | +150.2% | +86.8% | +52.0% | 2/2 names |
| Copper | +106.9% | +54.5% | +62.7% | 2/2 names |
| Construction & Engineering | +91.5% | +43.0% | +47.0% | 4/4 names |
| Electrical Components & Equipment | +65.7% | +23.8% | +27.3% | 5/5 names |
| Building Products | +63.7% | +22.3% | +25.7% | 2/2 names |
| Independent Power Producers & Energy Traders | +10.8% | -17.2% | -6.8% | 3/3 names |
| Data Center REITs | +8.1% | -19.2% | -2.2% | 2/2 names |
Every selected stock: cumulative returns
| Stock | Baseline | Early AI | Compute | CapEx |
|---|---|---|---|---|
| NVDA | +130.2% | +127.5% | +337.8% | +62.7% |
| AMD | +31.0% | +80.0% | +11.7% | +363.8% |
| AVGO | +64.0% | +48.3% | +247.6% | +49.8% |
| MU | +1.4% | +22.5% | +28.7% | +1,008.0% |
| AMAT | +48.6% | +41.7% | +32.6% | +146.8% |
| LRCX | +43.5% | +42.7% | +28.3% | +237.5% |
| KLAC | +84.7% | +32.4% | +54.1% | +146.9% |
| ANET | +137.7% | +16.2% | +214.7% | +69.2% |
| CSCO | +4.0% | +9.3% | +26.8% | +96.6% |
| CIEN | +12.2% | -5.0% | +86.4% | +314.0% |
| DELL | +51.1% | +22.7% | +155.7% | +348.2% |
| HPE | -0.5% | +2.4% | +55.9% | +196.1% |
| SMCI | +189.7% | +132.7% | +88.3% | +15.1% |
| APH | +44.1% | -1.0% | +89.0% | +128.1% |
| GLW | +19.4% | -2.8% | +63.4% | +172.3% |
| VRT | +29.9% | +13.9% | +598.6% | +84.0% |
| ETN | +68.2% | +15.9% | +97.6% | +18.2% |
| HUBB | +71.2% | +17.2% | +55.6% | +6.0% |
| POWL | -44.2% | +144.3% | +280.3% | +119.7% |
| NVT | +54.6% | +15.3% | +66.3% | +100.8% |
| PWR | +252.0% | +17.4% | +90.1% | +83.5% |
| FIX | +152.4% | +19.7% | +190.0% | +205.4% |
| EME | +65.8% | +15.8% | +179.6% | +47.4% |
| MTZ | +20.1% | +25.7% | +40.5% | +29.6% |
| TT | +62.0% | +6.1% | +124.7% | +26.6% |
| JCI | +51.5% | +8.4% | +32.6% | +100.8% |
| CEG | N/A | -10.3% | +169.4% | +16.9% |
| VST | +8.8% | +8.6% | +478.5% | +7.4% |
| NRG | +23.9% | -22.1% | +178.3% | +8.1% |
| EQIX | +1.4% | +24.8% | +39.5% | +10.1% |
| DLR | -8.2% | -7.7% | +108.4% | +6.2% |
| FCX | +148.3% | +10.2% | +12.1% | +77.5% |
| SCCO | +26.7% | +47.1% | +45.0% | +136.3% |
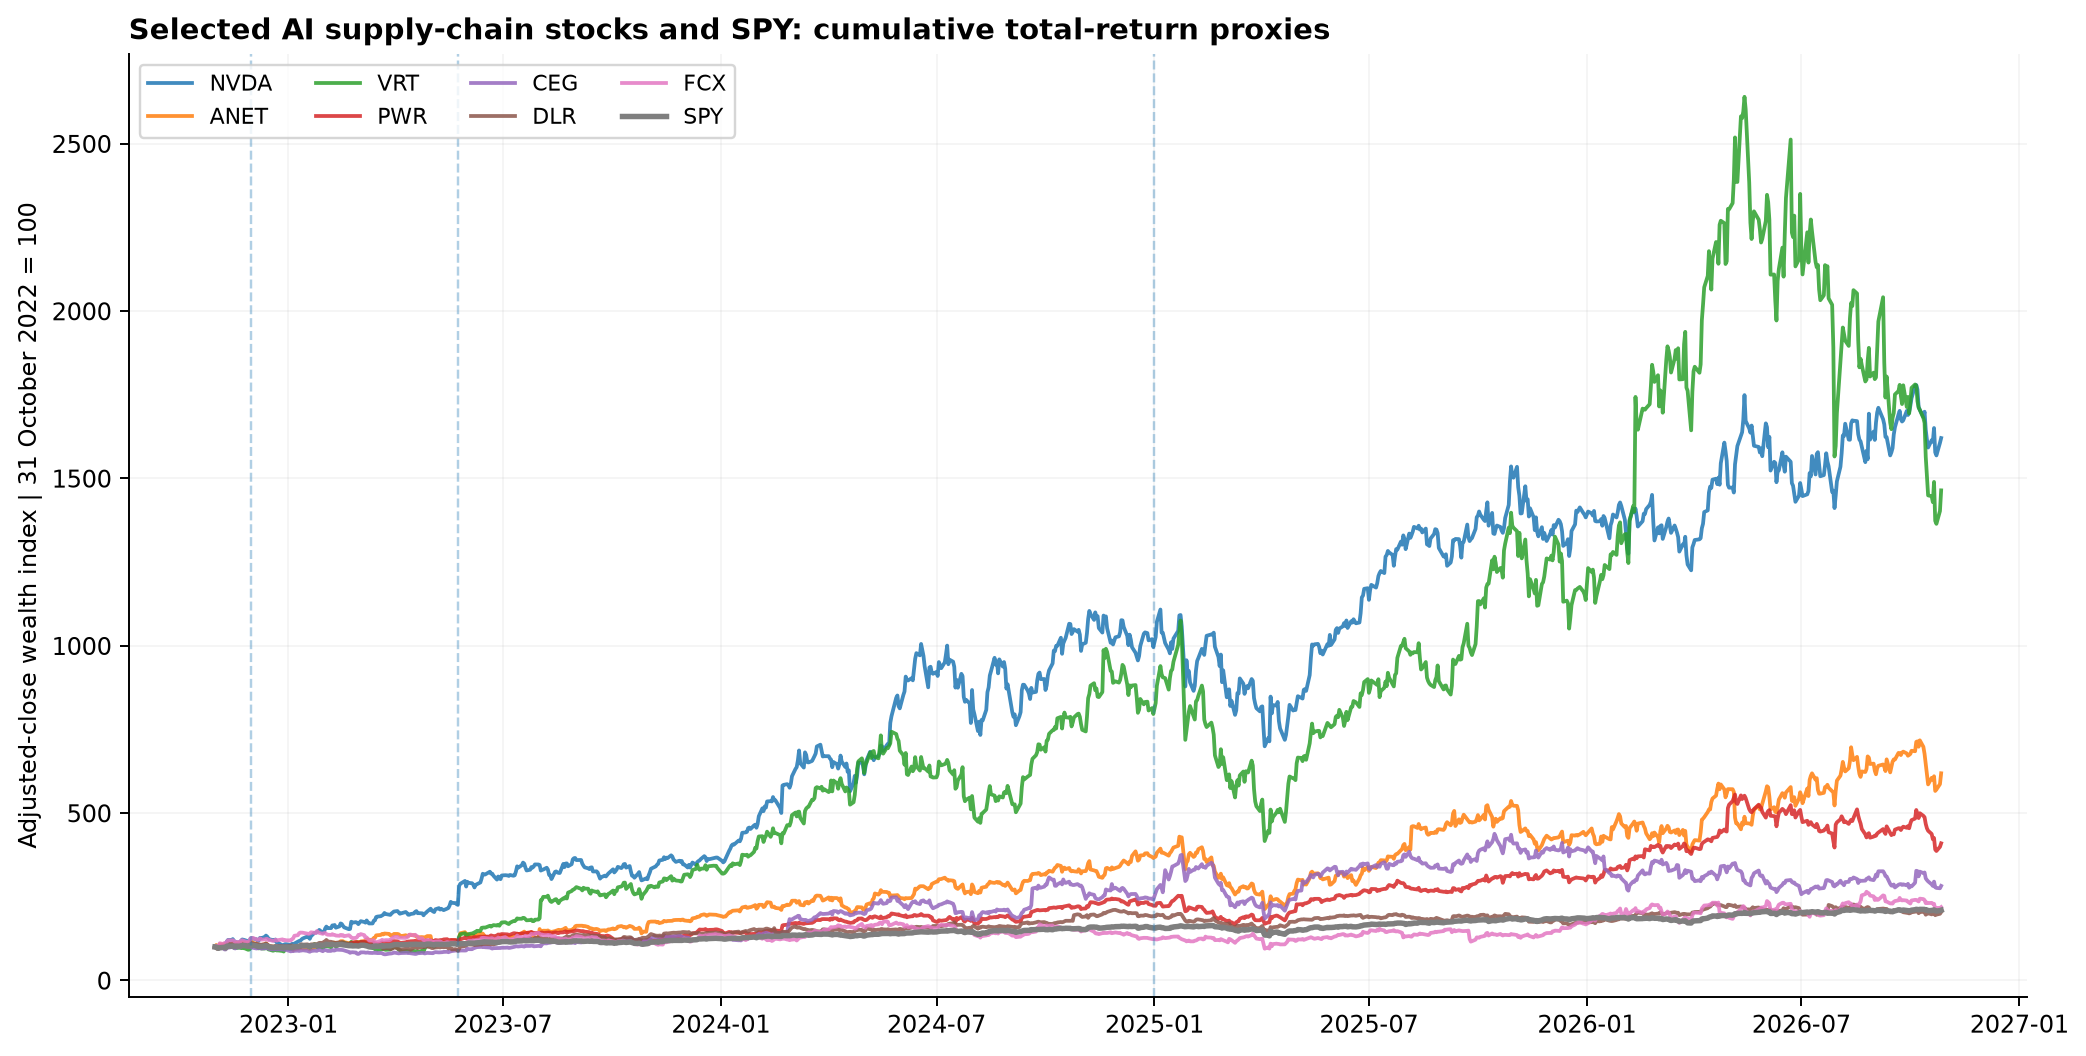
Figure 5. Selected stocks rebased to 100 on 31 October 2022. The lines use dividend/split-adjusted price proxies; selection is illustrative, not a benchmark portfolio.
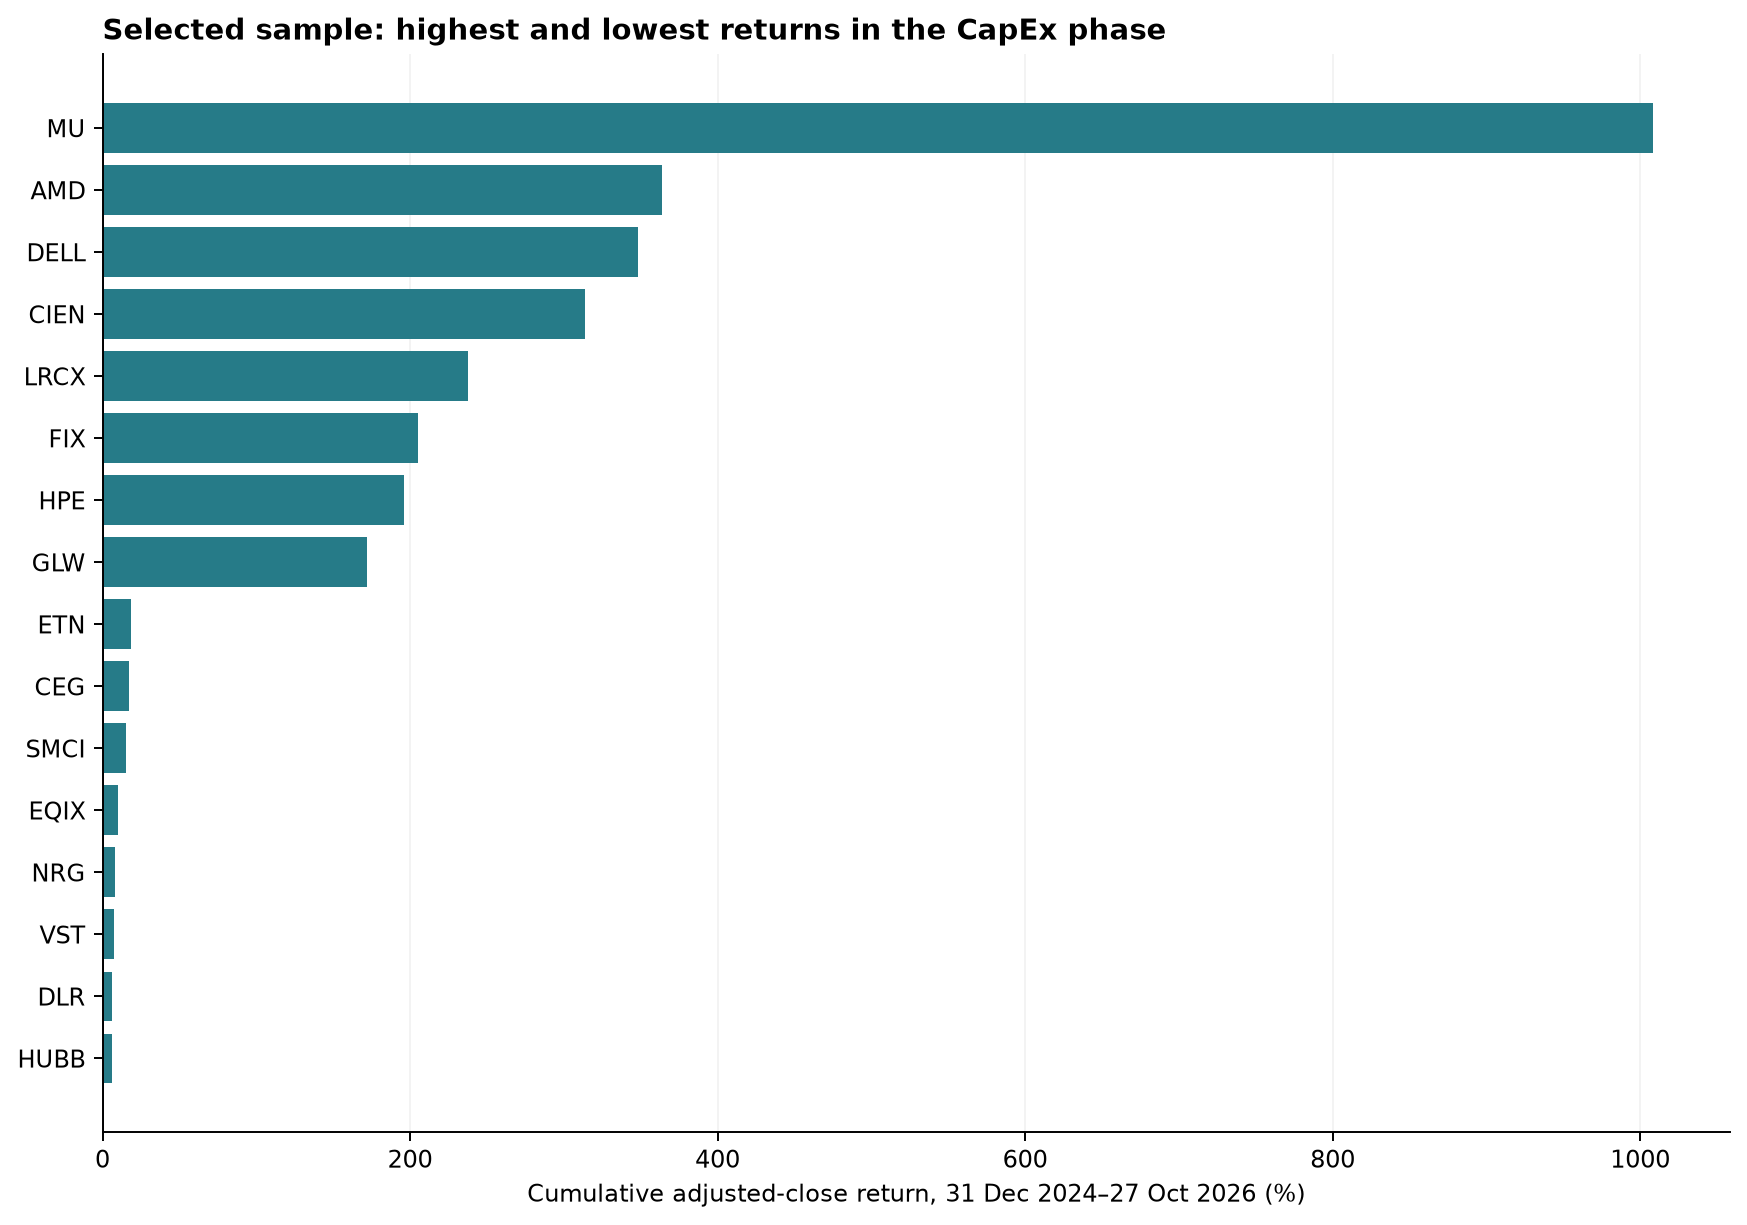
Figure 6. Cross-sectional dispersion among the named research stocks. Do not infer market-wide winners from this selected sample.
Annual comparisons and cumulative study returns
| sector | 2024 | 2025 | 2026 YTD | Since Oct 2022 | Since Dec 2023 |
|---|---|---|---|---|---|
| Communication Services | +34.7% | +23.1% | -11.2% | +124.5% | +47.2% |
| Consumer Discretionary | +26.5% | +7.4% | -2.7% | +65.9% | +32.1% |
| Consumer Staples | +12.2% | +1.5% | +14.4% | +33.3% | +30.3% |
| Energy | +5.6% | +7.9% | +55.6% | +72.9% | +77.2% |
| Financials | +30.6% | +14.9% | +3.3% | +75.8% | +54.9% |
| Health Care | +2.5% | +14.5% | +17.2% | +44.2% | +37.5% |
| Industrials | +17.3% | +19.3% | +9.1% | +88.7% | +52.8% |
| Information Technology | +21.6% | +24.6% | +32.1% | +204.8% | +100.2% |
| Materials | +0.1% | +9.9% | +15.6% | +51.1% | +27.3% |
| Real Estate | +5.1% | +2.6% | +7.7% | +32.7% | +16.2% |
| Utilities | +23.3% | +16.0% | +2.5% | +44.8% | +46.6% |
Hyperscalers as investors rather than suppliers
| Stock | 2024 | 2025 | 2026 YTD | Since Oct 2022 | Since Dec 2023 |
|---|---|---|---|---|---|
| MSFT | +12.9% | +15.6% | +10.6% | +136.5% | +44.3% |
| AMZN | +44.4% | +5.2% | +9.7% | +147.1% | +66.6% |
| GOOGL | +36.0% | +66.0% | +2.6% | +242.4% | +131.7% |
| META | +66.0% | +13.1% | -5.8% | +572.1% | +76.9% |
| ORCL | +60.0% | +18.1% | -32.1% | +75.8% | +28.3% |
How to reproduce or audit the tables
The downloadable data files contain all ten windows, including an after-hours event-boundary robustness check, for each sector proxy, every representative sub-industry, each individual stock and the demand-side names, with annualised and geometric relative performance against SPY and each stock’s parent sector. The series is in USD and incorporates the vendor’s adjusted-close convention. The Python script deliberately leaves a stock’s return blank if either exact boundary close is unavailable, instead of replacing missing history with future prices.
Sector table (CSV) · Sub-industry table (CSV) · Individual-stock table (CSV) · Hyperscalers (CSV) · Replication source code (ZIP) · SHA-256 manifest (JSON)
Data-access note: The exact adjusted-price snapshot is retained privately with the research code and is not redistributed publicly because the vendor restricts redistribution. The public downloads are derived return tables, source code and a checksum manifest; the code can be used to request a new dataset under the user’s own market-data permissions. A fresh download may not reproduce frozen vendor-adjusted history exactly. Coverage note: A missing early historical period is not assumed to be a zero return. The CSV reports n_eligible and n_named for every custom basket and available for each stock period. Classifications are contemporary research labels, not timestamped constituent memberships.
6. Interpreting any apparent change in market leadership
The hypothesis is that market leadership began with a concentrated revaluation of accelerated-computing suppliers, then spread into supporting infrastructure as hyperscaler spending scaled up. It could show up in three different ways: infrastructure baskets begin to beat SPY; they outperform their own parent sectors; and a wider share of the basket constituents participates rather than one extraordinary stock explaining the apparent effect.
Observed leadership was uneven, not universal. In the January 2025–October 2026 window, the selected semiconductor basket returned +371.1%, electrical components +65.7%, construction and engineering +91.5%, independent power producers +10.8%, and data-centre REITs +8.1%. The latter two baskets underperformed SPY, notwithstanding their plausible links to data-centre investment. The Energy sector ETF (XLE, +67.8%) is largely an oil-and-gas exposure; it is not a proxy for electricity generators or proof of an AI-driven utilities rally.
None of those patterns is guaranteed. A semiconductor rally may be dominated by multiple expansion rather than earnings growth. Electrical equipment and construction shares can rise with broader industrial investment. Utilities react to interest rates, fuel prices, market regulation and contracted supply arrangements. Copper producers are influenced by global industrial demand, inventories, exchange rates and mining costs. A theme can be economically compelling but already fully priced.
The return matrices therefore answer a descriptive question about performance and timing. To move towards causal inference, subsequent work would need point-in-time revenue-exposure data, pre-specified treatment and control groups, factor controls, and ideally firm-level changes in confirmed orders, backlog or cash flows. Even event-study results around 24 May 2023 would need careful handling of overlapping information releases.
Semiconductor concentration sensitivity (January 2025–27 October 2026). The selected four-stock semiconductor basket returned +371.1%, but Micron (MU) alone returned +1,008.0%. As a robustness check, excluding Micron and applying the same equal-dollar, buy-and-hold calculation to Nvidia (NVDA), AMD and Broadcom (AVGO) produces +158.8%. This remains a substantial gain, but the difference illustrates how strongly an illustrative, small-stock basket can be influenced by a single extraordinary winner. These are not official historical GICS index returns.
7. Risks: when the CapEx boom becomes a valuation problem
The larger the anticipated investment programme, the more important it becomes to distinguish orders, revenue, profit, cash flow and economic return. Supply constraints can benefit an incumbent vendor temporarily; expanding capacity can later weaken pricing. Faster depreciation or large finance-lease commitments may lower free cash flow even while accounting revenue expands. Rising interest rates increase the discount rate applied to long-duration infrastructure cash flows. Power availability, permitting, grid lead times, cooling and land costs can delay capacity additions.
There is also a feedback risk. If future AI revenue fails to meet expectations, hyperscalers could moderate the pace of investment. A supplier with a concentrated customer base could then experience a sharp decline in earnings expectations. A convincing AI demand story is not sufficient to demonstrate attractive prospective equity returns at every valuation.
8. Data, reproducibility and limitations
Reproducible research files: Download the source-code pack alongside the derived sector, selected sub-industry and individual-stock return tables, peer-relative results, coverage fields, and a dated SHA-256 manifest linked above. The underlying full-resolution Yahoo Finance price snapshot is archived privately for numerical audit and is not offered for redistribution. The code and precise input dates are provided for independent implementation using data obtained with appropriate permissions.
The prototype implementation uses yfinance adjusted closing prices and records exact date boundaries, source checksums, ticker universe, library version and missing observations. yfinance is not a licensed open-market-data redistribution service. Since adjusted prices can be revised by a vendor, we retain the frozen downloaded dataset privately to reproduce these specific numbers exactly. Where a stock was not yet listed at the start of a window, the table reports N/A rather than silently back-filling it. For example, Constellation Energy’s independently listed history does not span the whole pre-2022 baseline.
Four limitations should remain visible when interpreting the tables. First, selected current constituents create survivorship and thematic-selection bias. Second, equal-weight baskets are not market-cap-weighted GICS indices, and ETF holdings evolve through time. Third, total return is not risk-adjusted alpha; the study does not establish a causal AI impact or subtract trading costs. Fourth, hyperscaler spending definitions and fiscal year-ends differ, so the expenditure table is evidence of scale, not a summable AI CapEx series.
For an institutional replication, the preferred upgrade is point-in-time GICS constituent and float-adjusted weighting data from S&P/MSCI combined with licensed dividend-adjusted pricing and company-level historical fundamentals. That permits formal sub-industry index reconstruction and proper treatment of delistings, spin-offs and reclassifications.
9. Frequently asked questions
Is hyperscaler CapEx the same as AI spending?
No. Capital expenditure is the total investment reported under a company’s accounting convention. It may include AI servers and data centres, but also conventional cloud workloads, buildings, logistics and other company assets. Finance-lease treatment differs across companies.
Did AI stock-market leadership move from Nvidia to utilities and infrastructure?
That is a testable hypothesis, not a fact established by CapEx figures alone. To assess it, compare fixed-date, adjusted-price total returns for sector proxies, explicitly selected sub-industry baskets and individual firms, both against SPY and against their parent sectors. The tables above provide that comparison once the analysis is executed.
Are these official GICS sub-industry performance indices?
No. The official GICS framework supplies the taxonomy. The calculated sub-industry figures here are transparent, custom equal-weight research baskets. They should not be confused with licensed, point-in-time constructed MSCI or S&P indices.
Why stop at 27 October 2026?
The study freezes its sample at the last completed US session before the 28 October research date. A fixed end-point prevents intraday movements from changing the reported result and makes the tables reproducible.
Primary sources and reading
- OpenAI (30 November 2022): Introducing ChatGPT
- Nvidia (24 May 2023): Fiscal Q1 2024 results
- Microsoft: FY2026 Annual Report
- Amazon: 2025 annual results and 2026 expectations
- Alphabet: FY2025 filings and Q2 2026 10-Q
- Meta: FY2025 results and Q3 2026 results / updated CapEx guidance
- Oracle: FY2026 annual results
- International Energy Agency (2025): Energy and AI
- MSCI: GICS taxonomy and historical revisions
- Yahoo Finance: market-data redistribution restrictions
- Cambridge Associates (November 2025): Electrifying Returns in the AI Era
This is descriptive research, not personalised investment advice. The company examples are selected to trace possible economic exposure; inclusion is not a recommendation to buy.