Trading strategies explained · Cenk Ufuk Yildiran · 26 October 2026
What if you bought stocks that were already doing well? Instead of searching for bargains, you would look for companies whose shares had risen strongly over recent months, traded near their highest prices of the year and were pushing to new highs. It sounds like a sensible way to follow the market’s winners.
That is the idea behind Momentum52, a rule-based strategy tested on U.S. mid-cap stocks. But after accounting for when the strategy could buy, how much it could invest, and when it had to sell, the later historical evidence was disappointing. The strategy made a small gain in its development period and then lost about a third of its starting capital in the original validation period.
This is a plain-English companion to Post 3, the technical Momentum52 replication. Just as Post 2 explains the earlier breakout-and-pullback research in Post 1, this article explains what Momentum52 was trying to do, how the trades worked and why the test failed. No knowledge of Python or financial mathematics is required.
1. What does “buying momentum” mean?
Imagine two shares. One has spent the past year falling and now appears cheap. The other has spent much of the year climbing and trades just below its annual peak. Momentum52 is interested in the second share—not because it must keep rising, but because the strategy tests whether recent strength might continue.
Two ideas sit behind its name:
- Momentum: has the stock risen meaningfully over several months? The system looks at approximately 12 months and six months of history but skips the most recent trading month when measuring those returns. That skip is intentional: a short-lived surge is not the same thing as sustained medium-term strength.
- 52-week high: is today’s closing price at least 95% of the highest high reached in the preceding 252 trading sessions? A stock with a prior high of $100 could pass this particular condition with a close of $95 or more. That does not mean the system buys just because a stock is near $95; many other rules must also be satisfied.
What does “near a 52-week high” look like?
In a candlestick chart, the thick part of each candle shows the opening-to-closing price range; the thin line, or wick, shows the day’s highest and lowest prices. In the diagrams below, a teal candle closed above its opening price and a red one closed below.
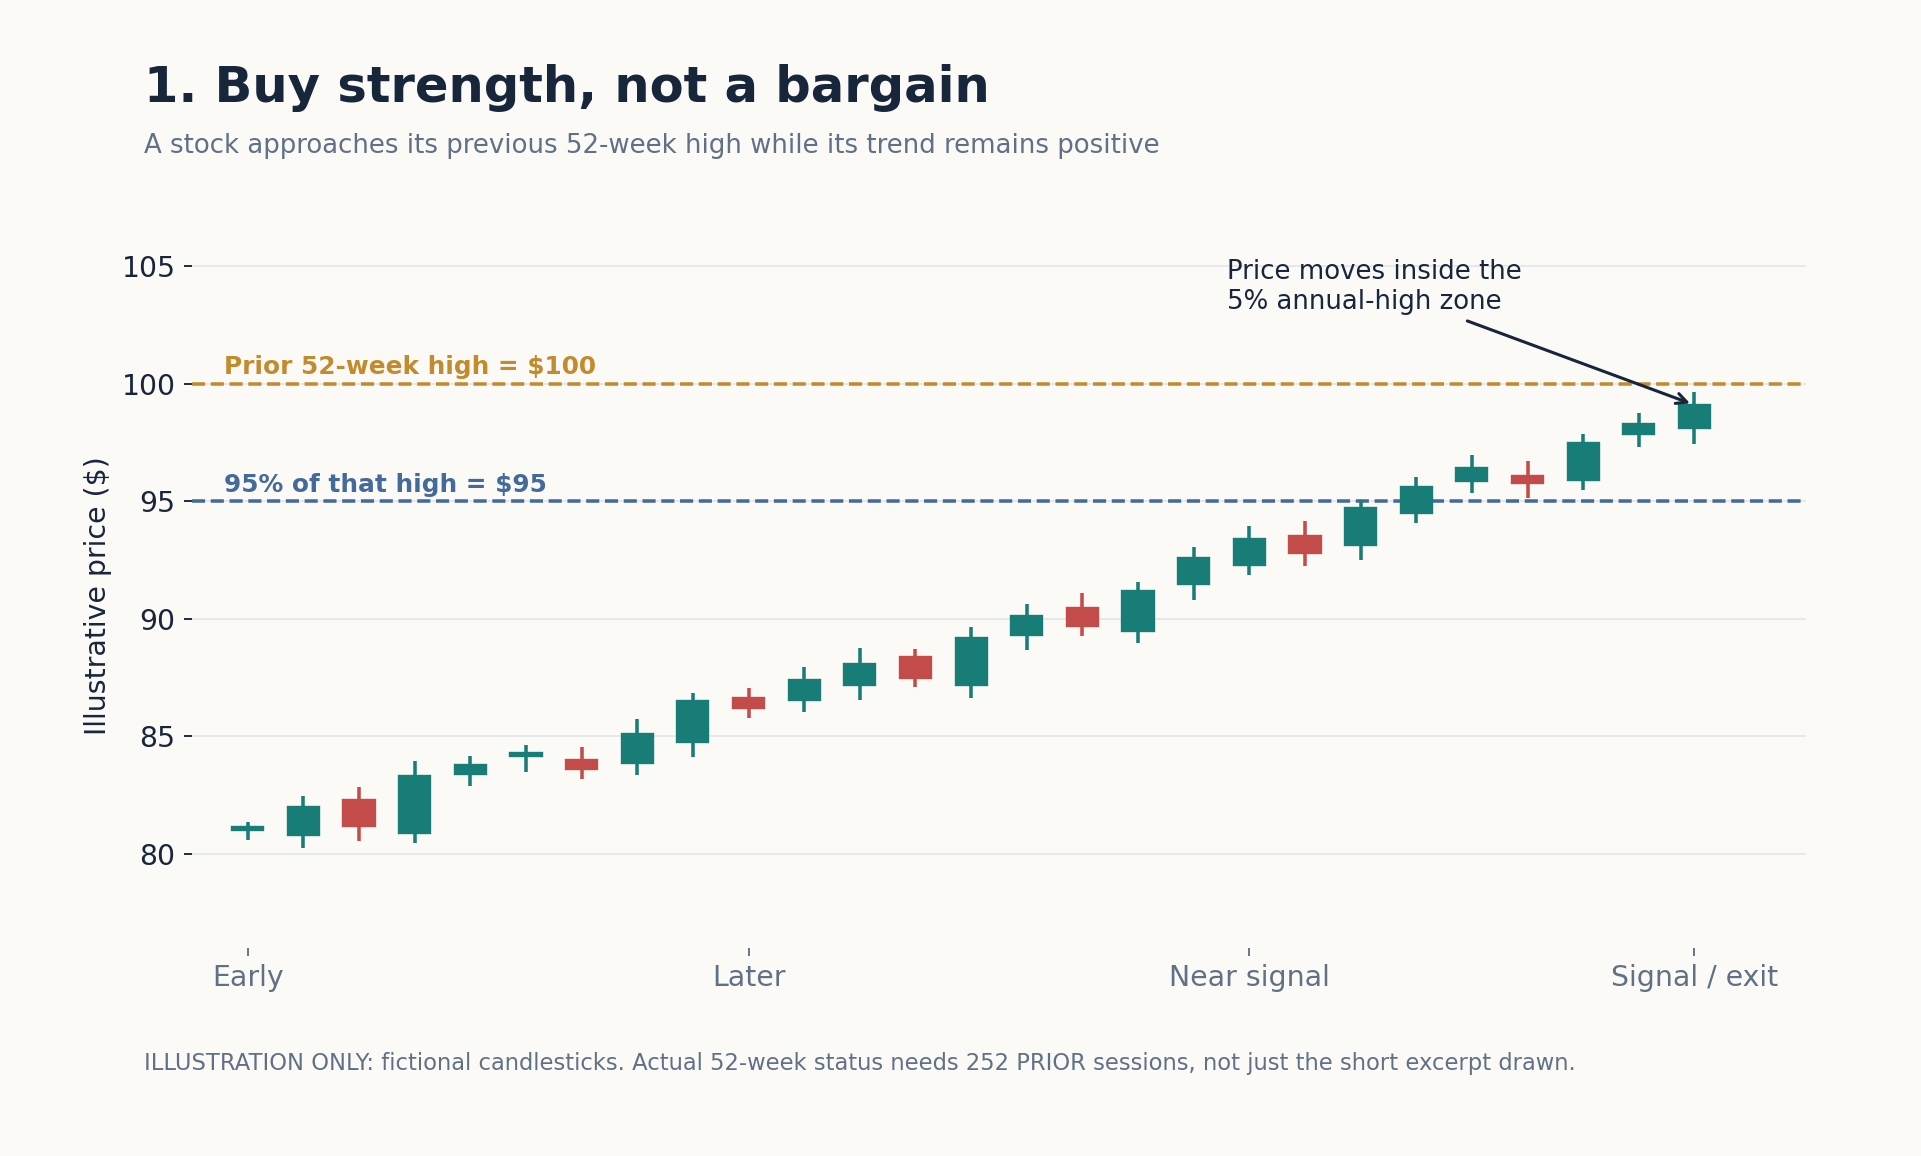
Figure 1. A fictional stock climbs into the zone within 5% of its previous annual high. Only a short segment of candles is shown; the real 52-week condition uses the preceding 252 trading sessions. This diagram does not depict an actual Momentum52 trade.
The idea has a foundation in the academic literature on return continuation and 52-week highs. But that research does not prove that this exact combination of rules will make money. The rules themselves still have to be tested.
2. A good-looking stock is not automatically a buy
Momentum52 runs several checks before a stock can enter the portfolio. Think of them as a sequence of gates.
First: a sustained upward trend. A stock must trade above its 50-session average; that average must be higher than its 200-session average and rising. A moving average is simply a rolling summary of past prices. The system also requires a share price of at least $10 and average daily trading value of at least $5 million.
Second: strength compared with the market. Over 126 sessions, the stock must have done at least as well as MDY, an exchange-traded fund tracking U.S. mid-cap shares. MDY itself must be in an upward trend. If that market check fails, the strategy does not admit new candidates.
Third: a breakout backed by trading activity. The share must close at or above the highest price reached in the preceding 55 trading sessions, with that day’s trading volume at least 20% above its 20-session average. It must also pass the medium-term momentum, annual-high-proximity and volatility checks.
What does the breakout rule look like?
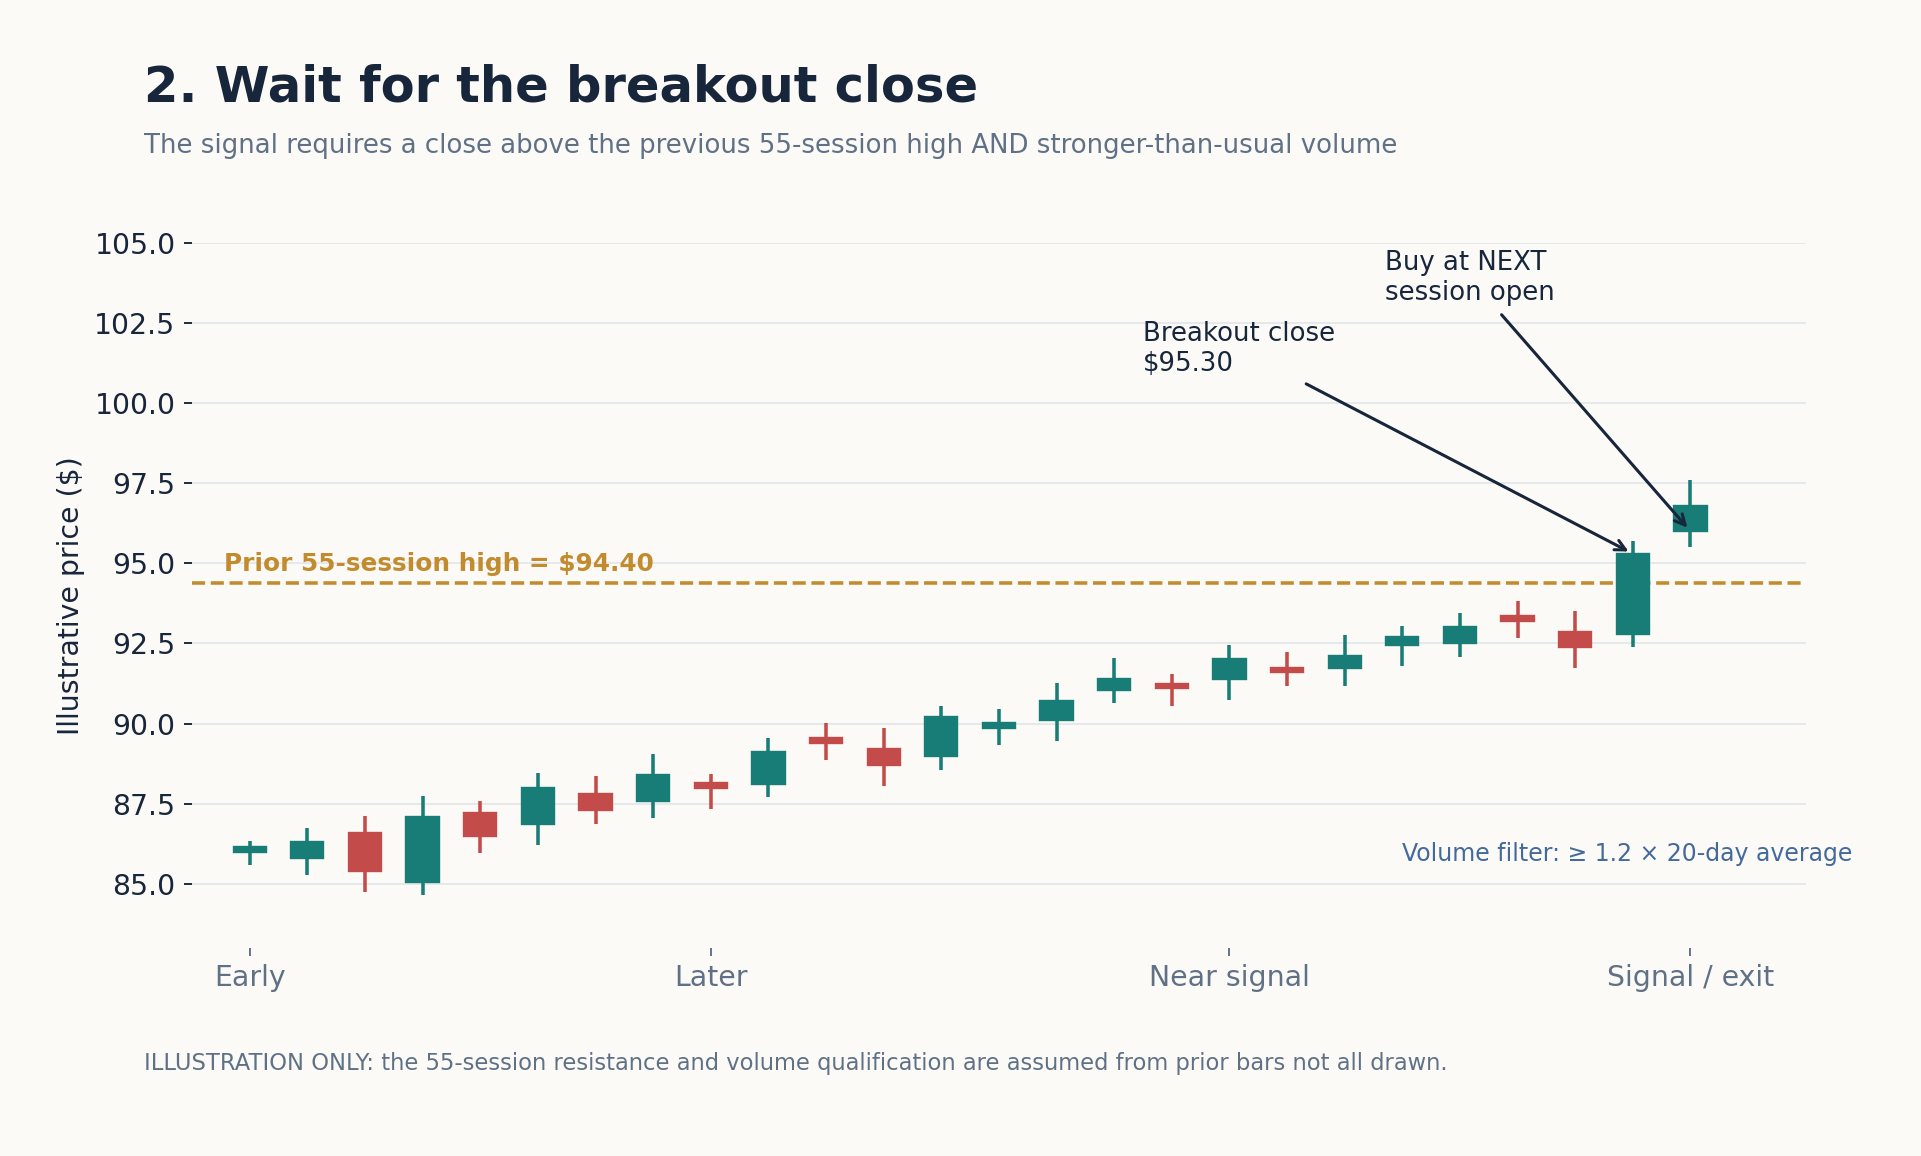
Figure 2. In this fictional example, a breakout is identified only at the session’s close. The earliest simulated purchase is at the next session’s open, which may be more expensive. The preceding 55-session price history and required volume comparison are assumed for teaching purposes, not fully plotted. This is not a recorded historical trade.
If several stocks pass the gates on the same evening, Momentum52 ranks them using a weighted score built from momentum, market-relative strength, closeness to the annual high and volume. The highest-ranked eligible stocks get first consideration. A high ranking score is not a probability of winning.
The reconstruction found 1,977 ranked candidate signals across 459 dates, yet the full historical portfolio closed only 113 trades. That difference is important: having an attractive candidate does not necessarily mean the portfolio has cash or a free position slot to buy it.
3. Buying is only half the system: how does it sell?
The research simulated a $5,000 portfolio, with no leverage and at most two open positions. Each new position was limited to $2,500, and its planned initial price risk to approximately $125. Simulated trading also included $1 commission on each buy and sell order and 0.05% adverse slippage on each side.
A trade could end in three main ways:
- Initial stop: an exit level below the executed purchase price, normally about 4%–8% lower depending on recent price volatility.
- Trailing stop: once a session’s high reaches 10% above the purchase price, the model activates a trailing exit level 5% below the highest observed high. This level can move upward to protect some of a gain; it does not guarantee that gain will be realised.
- Time limit: a position that survives the stop rules is closed after at most 30 trading-session holding bars, counting the entry session.
How do the stops work?
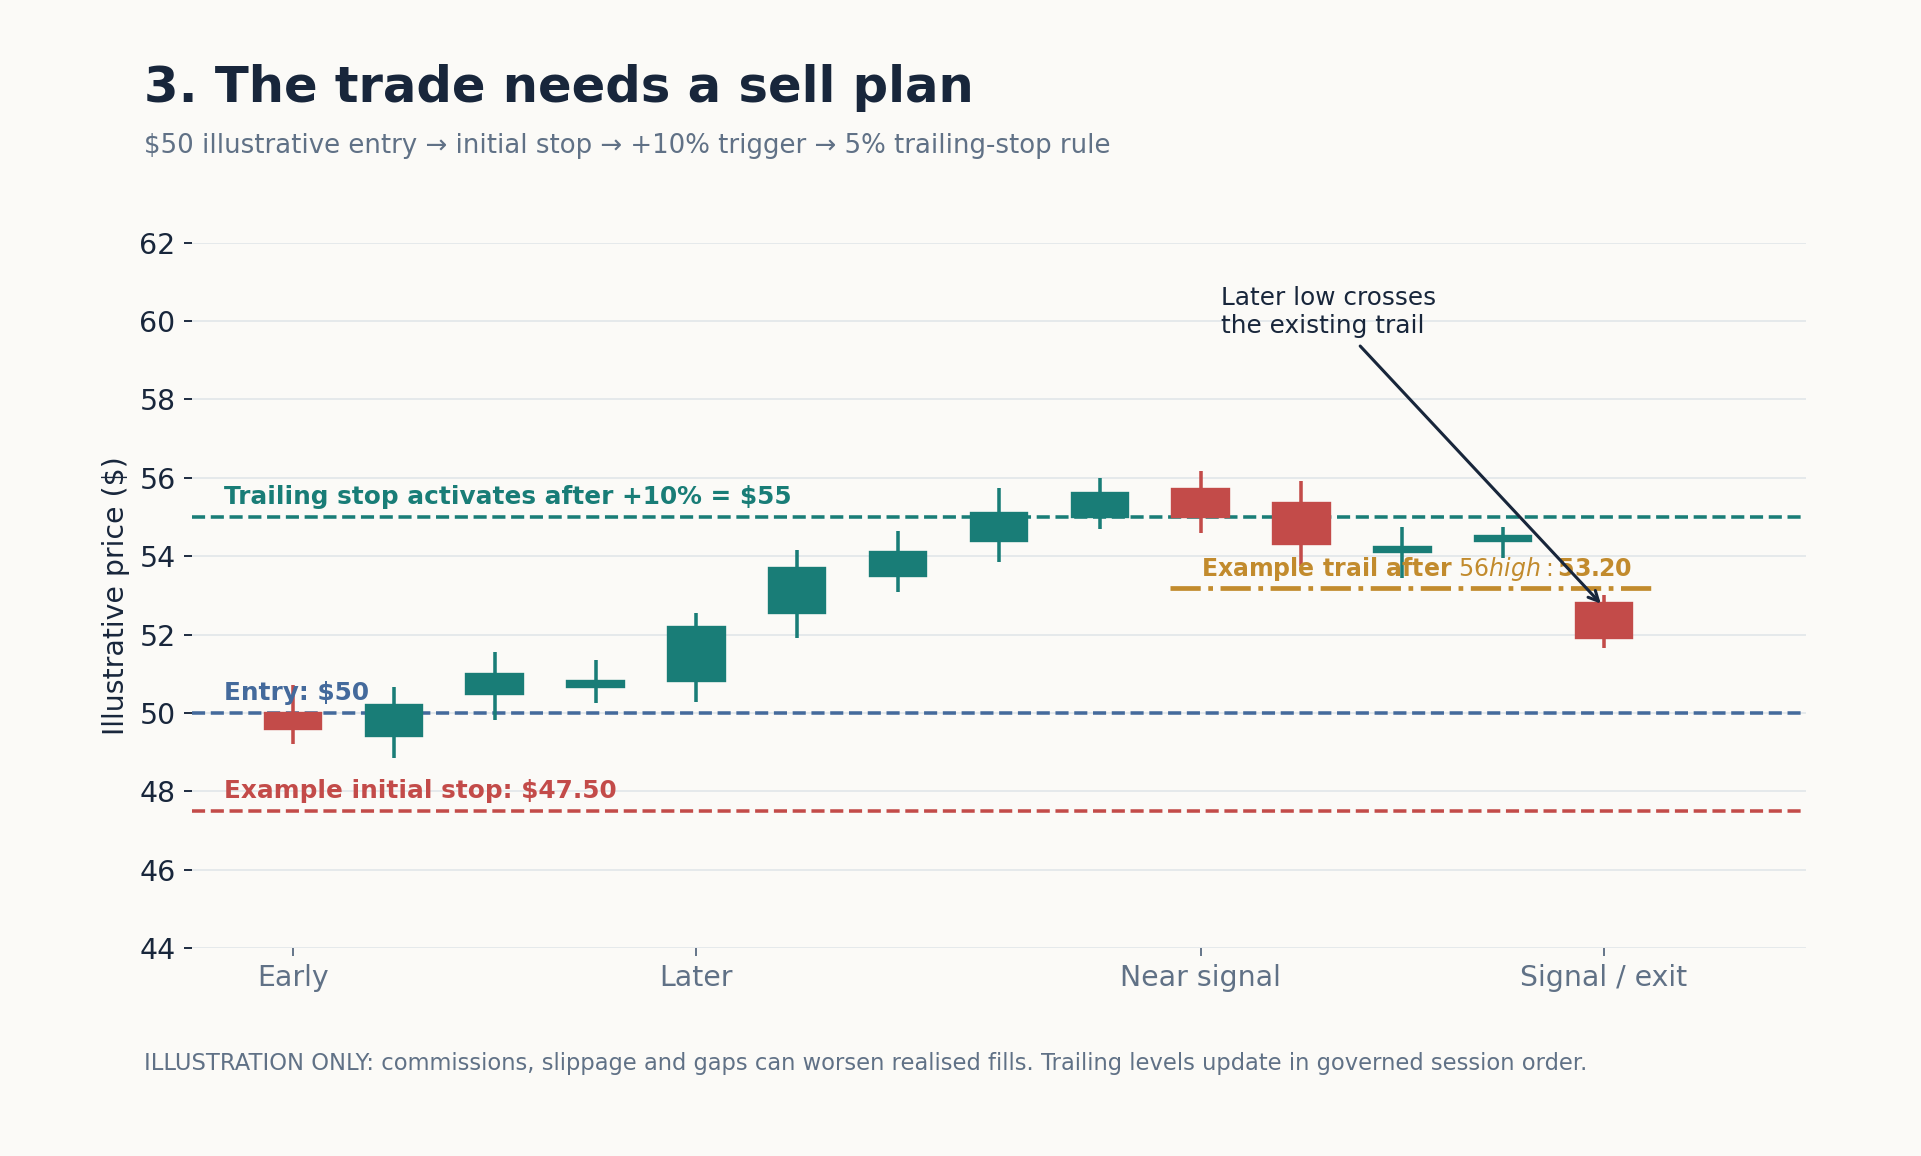
Figure 3. An illustrative, not historical, $50 entry. A 5% initial stop would be $47.50. If a later high reached $56, an activated 5%-below-high trailing level would be $53.20. The later decline demonstrates an exit signal. The computer does not retrospectively apply a newly raised stop to an earlier price low on the same day.
A stop is not a guaranteed sale price. If bad news arrives overnight, the next available opening price could be below the intended stop. The resulting loss can exceed the original risk estimate.
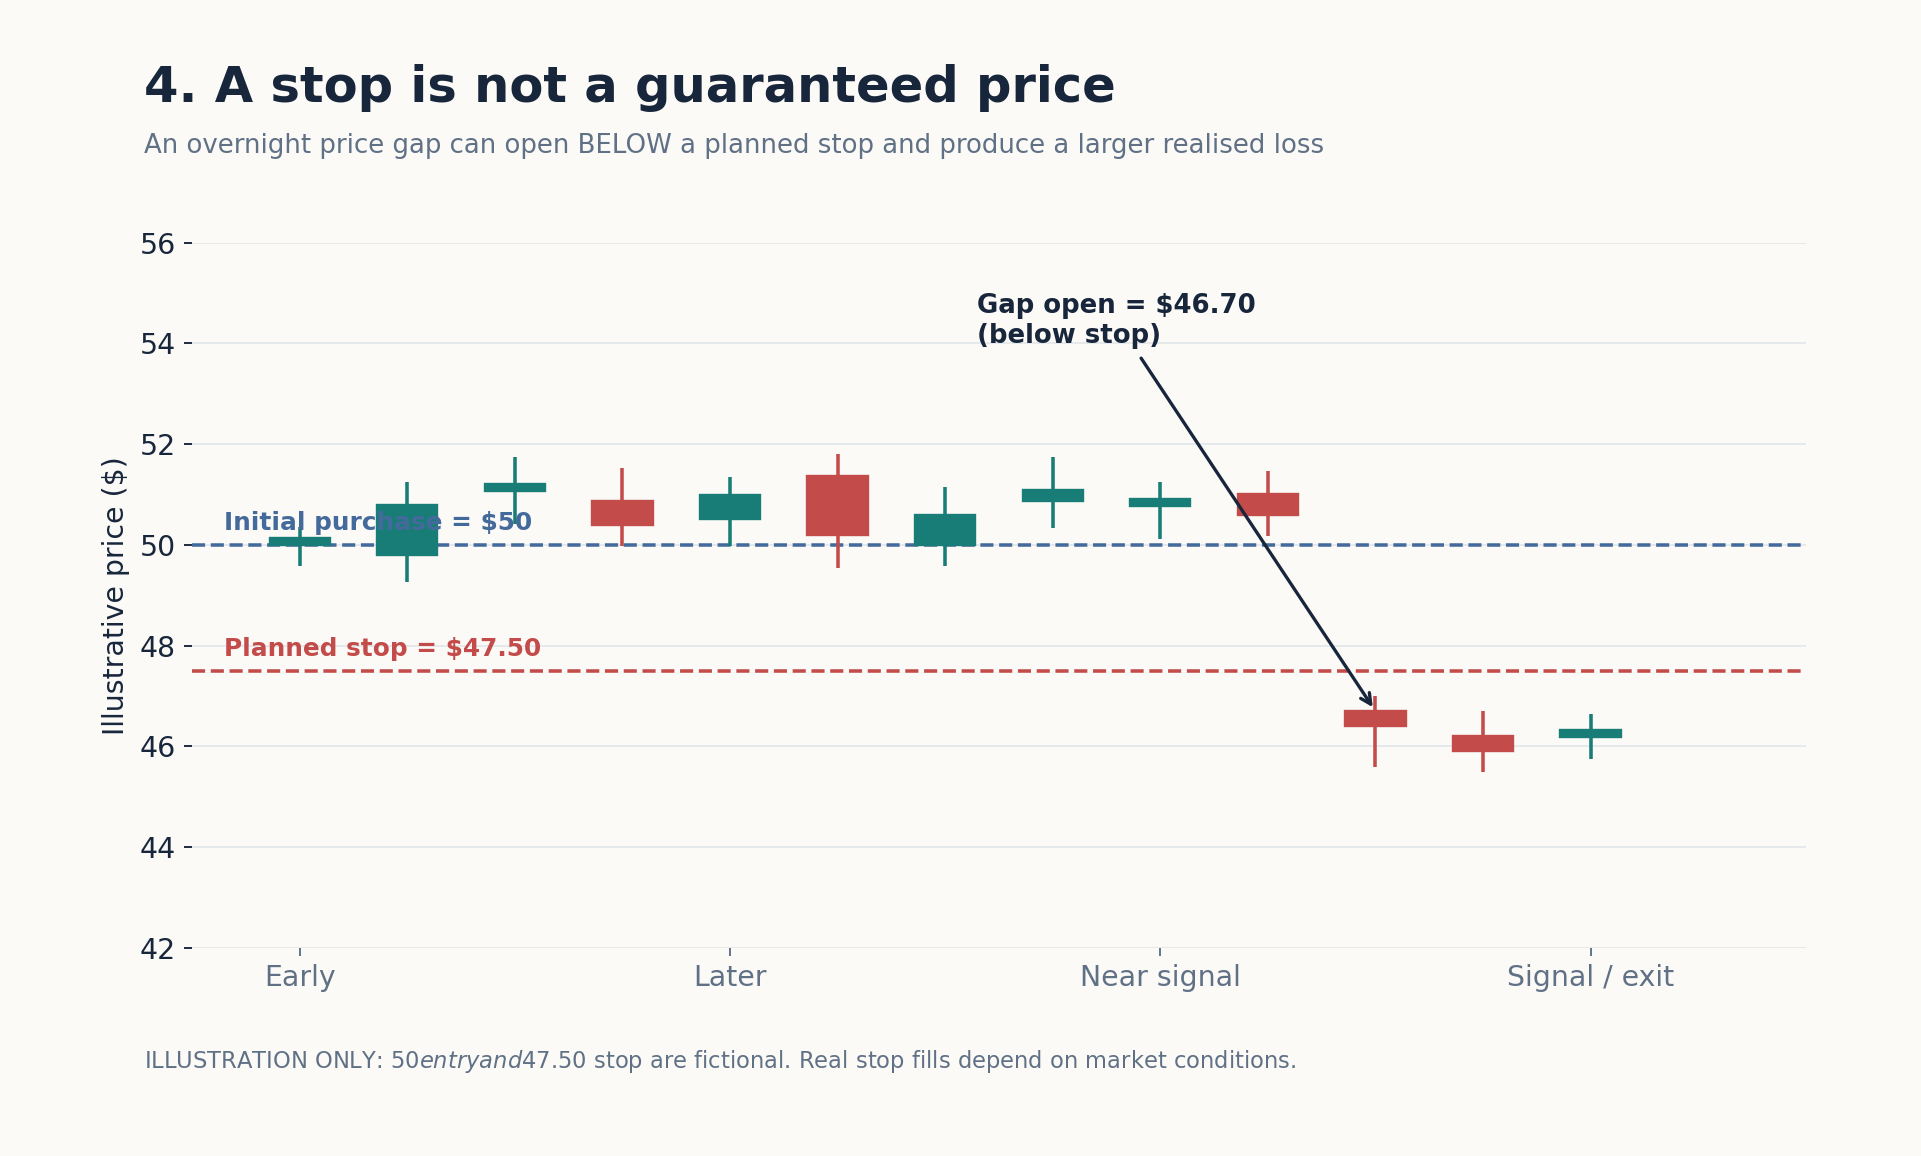
Figure 4. A fictional overnight gap. The planned exit was $47.50, but the next session opens at $46.70. An actual simulated stop fill can therefore be worse than planned. This is why a $125 planned price-risk limit is not a guaranteed $125 maximum loss.
4. The main result: a small early gain, then a large loss
The original research separated development from validation. The development period was where the strategy’s design could be evaluated; the later validation window was intended to test the previously chosen policy.
The original paper and the independent Post 3 reconstruction report 59 development trades and a +1.40% return, followed by 54 original-validation trades and a −34.10% return. The full historical reconstruction lost 34.29%, while a separately started common-period simulation lost 9.75%.
How much did the different backtests gain or lose?
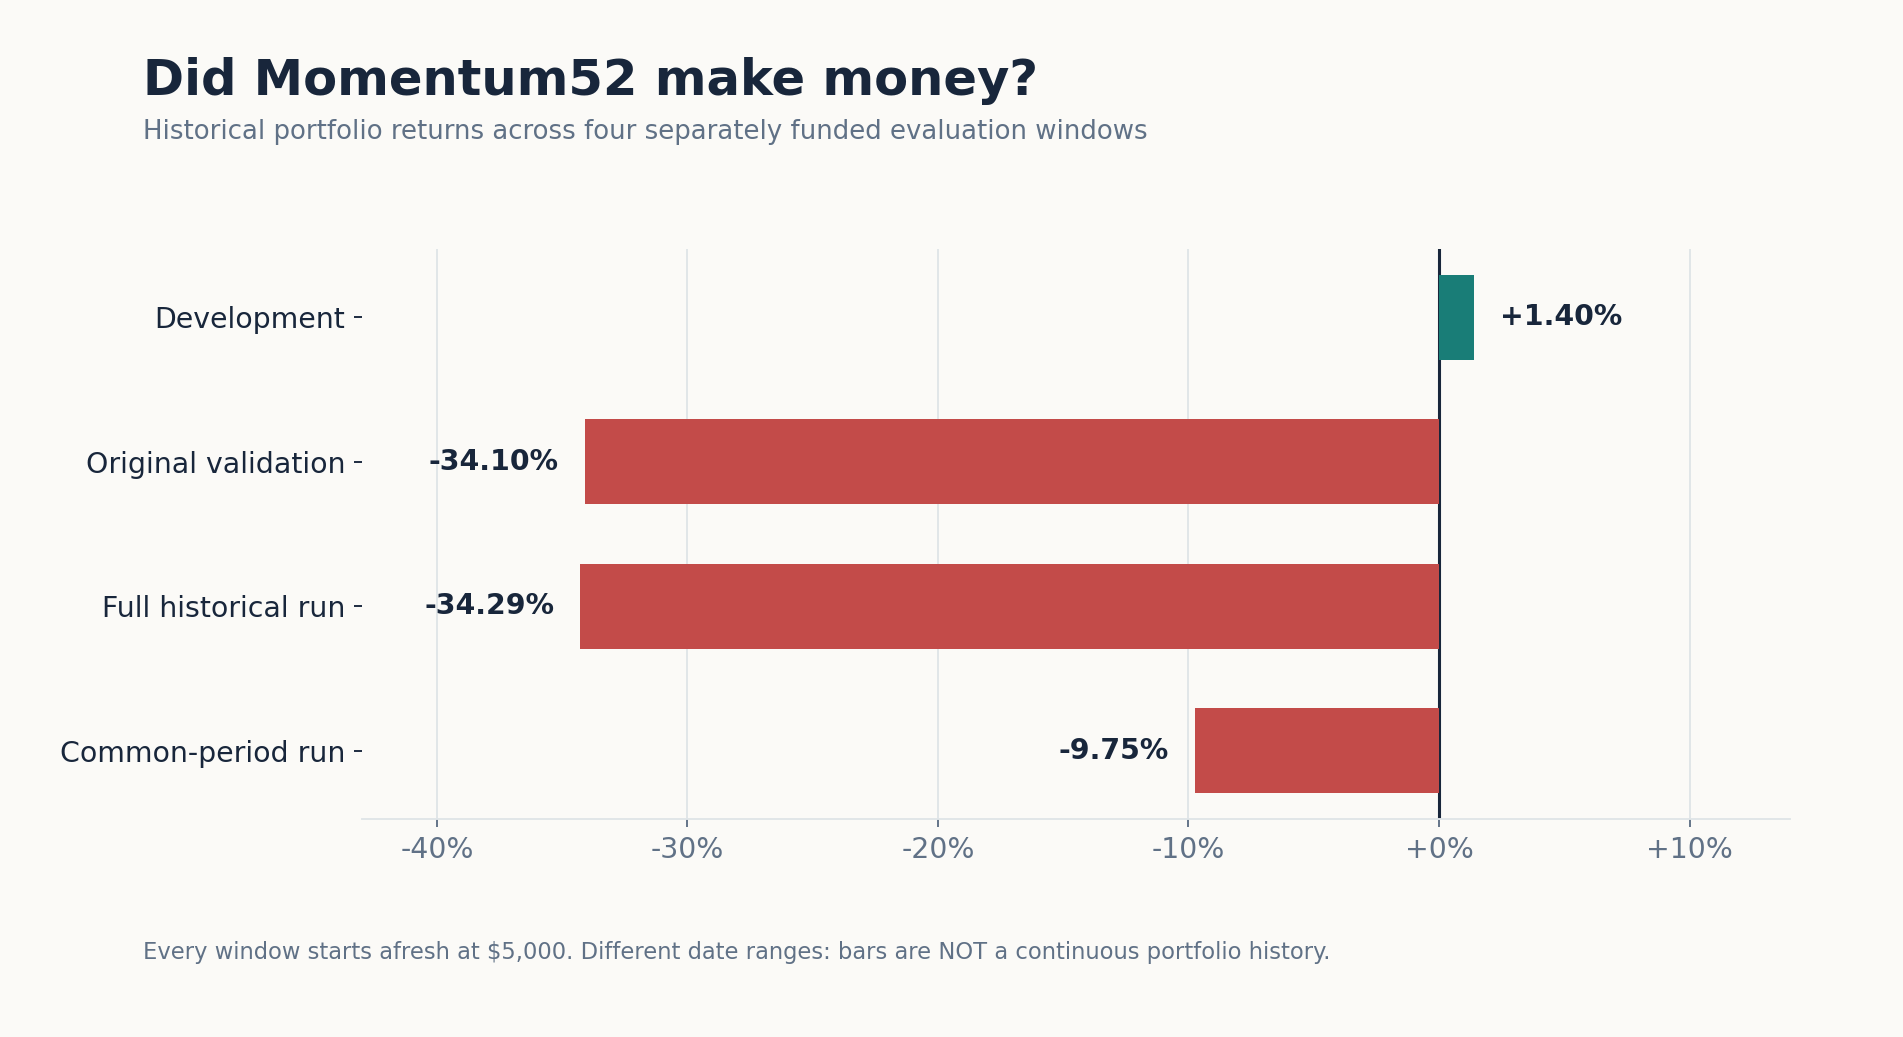
Figure 5. Actual audited portfolio returns from Post 3. Each bar describes a different independently funded $5,000 simulation; the periods differ or overlap, so the bars must not be added together or treated as a continuous trading account. The original validation period runs from 21 February 2025 to 10 September 2026.
This is the key distinction between an attractive-sounding story and evidence. A rule set that barely gained in development subsequently lost about a third of its capital in the original validation window. Re-running known historical dates in 2026 independently reproduces the result, but it does not create a new, untouched future test.
What would that have meant for $5,000?
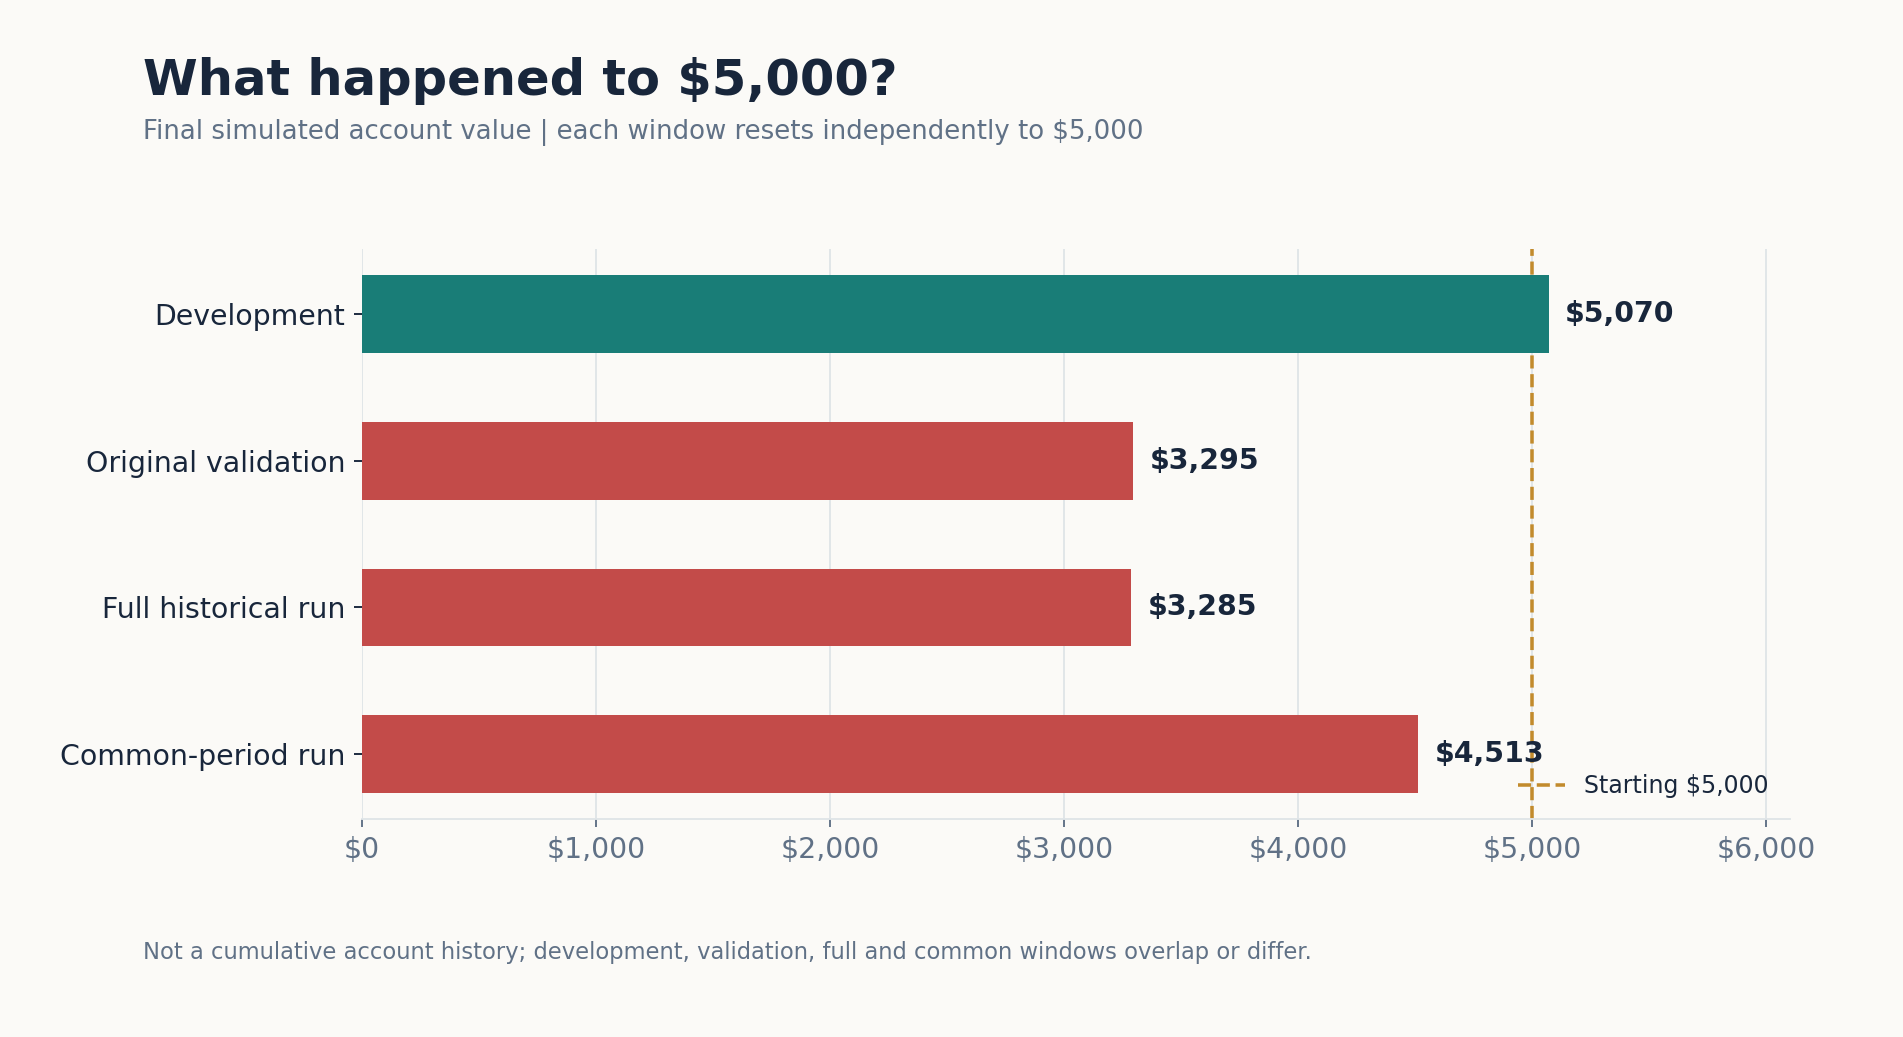
Figure 6. An easier way to read the same results. Each simulation starts afresh with $5,000: about $5,070 remains after development; $3,295 after the original validation; $3,285 after the full run; and $4,513 after the independently funded common-period run. These are not four successive stages of one account.
5. Why “some winning trades” was not good enough
Winning on a third of trades is not necessarily fatal if the wins are much larger than the losses. Likewise, winning on most trades does not guarantee an overall profit. The amounts matter.
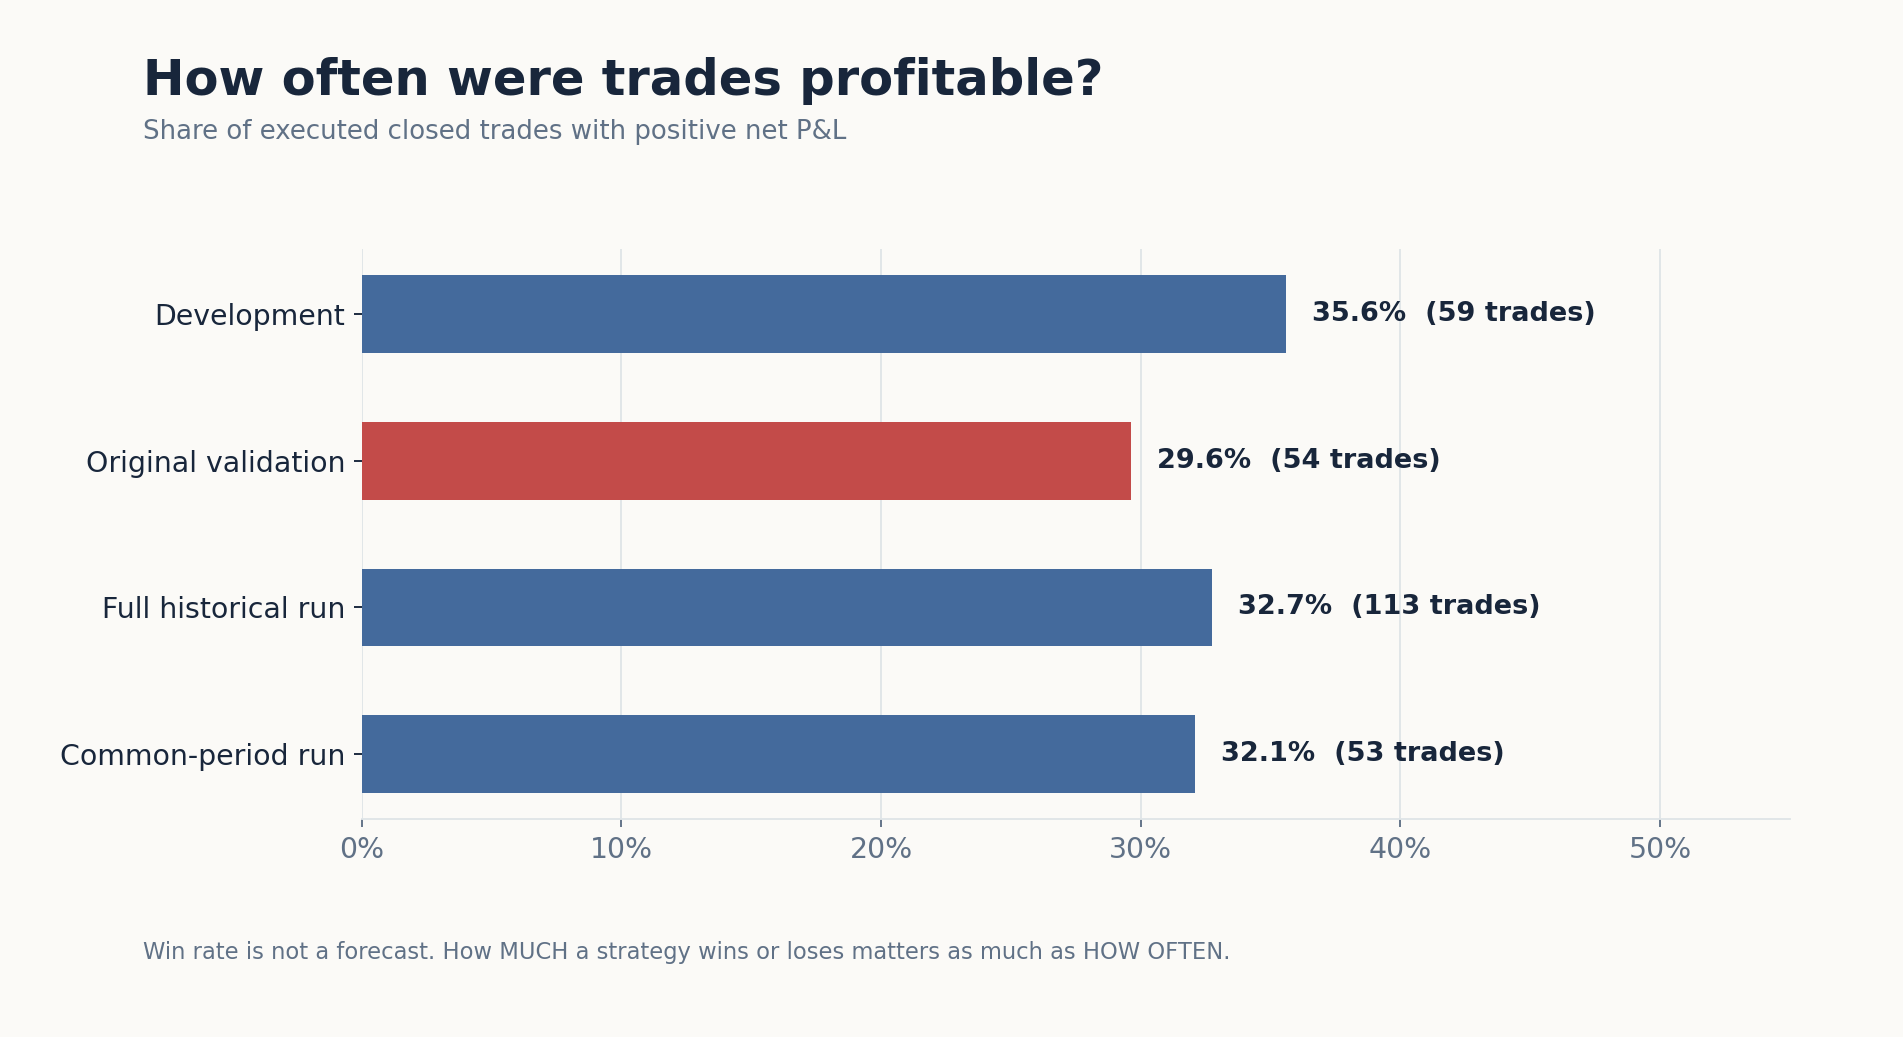
Figure 7. Historical net profitable-trade rates among trades actually executed: 35.59% of 59 development trades, 29.63% of 54 original-validation trades, 32.74% of 113 full-run trades and 32.08% of 53 common-period trades. These are historical frequencies, not forecasts.
One way to account for the size of trades is profit factor: add all winning trade profits, add the absolute losses of losing trades, then divide the first amount by the second. A reading below 1 means aggregate losing-trade amounts outweigh aggregate winning-trade amounts.
The original research set a tougher pass rule: profit factor of at least 1.20 in both development and validation, plus a positive validation-period return. That was specified as a validation gate, not invented after seeing the loss.
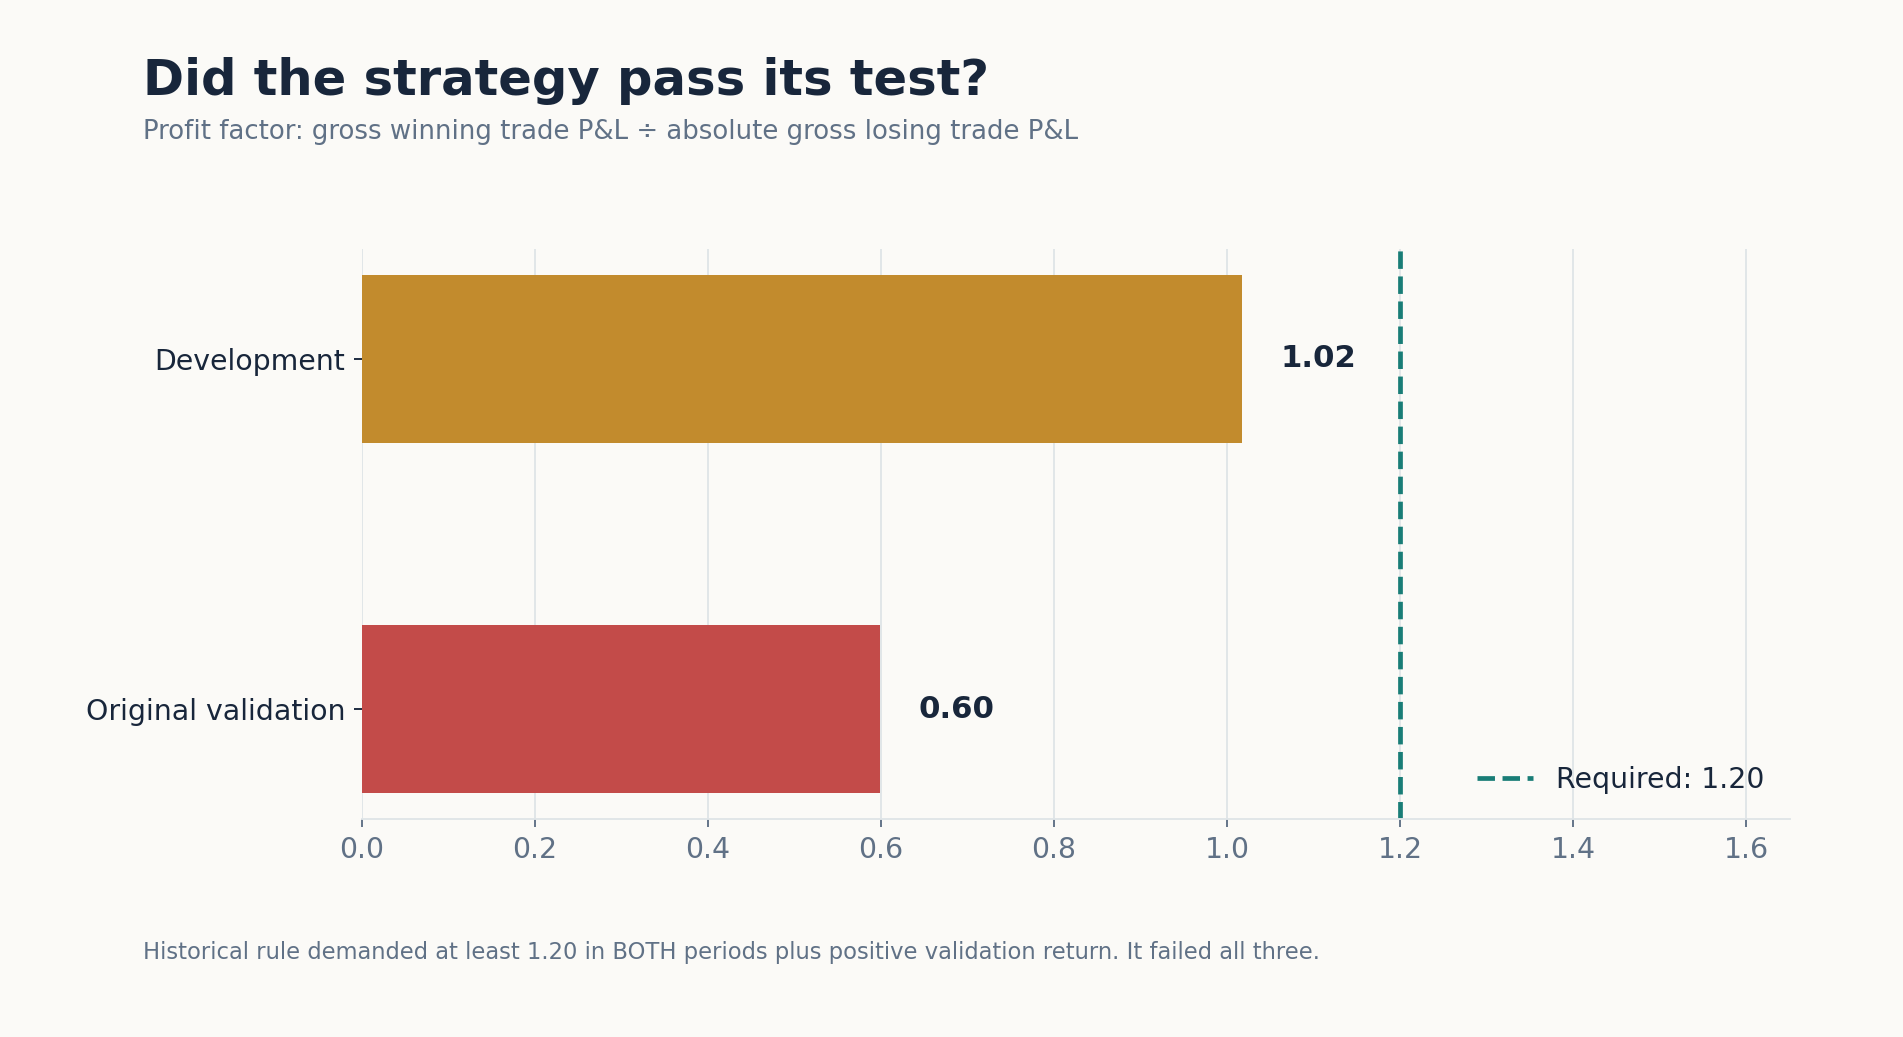
Figure 8. The strategy failed the predefined acceptance rule. Development profit factor was 1.0169, below 1.20; original-validation profit factor was 0.5985, also below 1.20; and the validation return was negative. In the original paper’s terms, Momentum52 was not validated.
6. How did it compare with simply following the mid-cap market?
A reader might reasonably ask: Would it have been easier just to buy the market?
For the same 30 July 2025–10 September 2026 comparison window, the independently funded Momentum52 portfolio fell by 9.75%. Over those dates, the raw close-to-close MDY price rose 15.65%. That is an underperformance gap of approximately 25.40 percentage points.
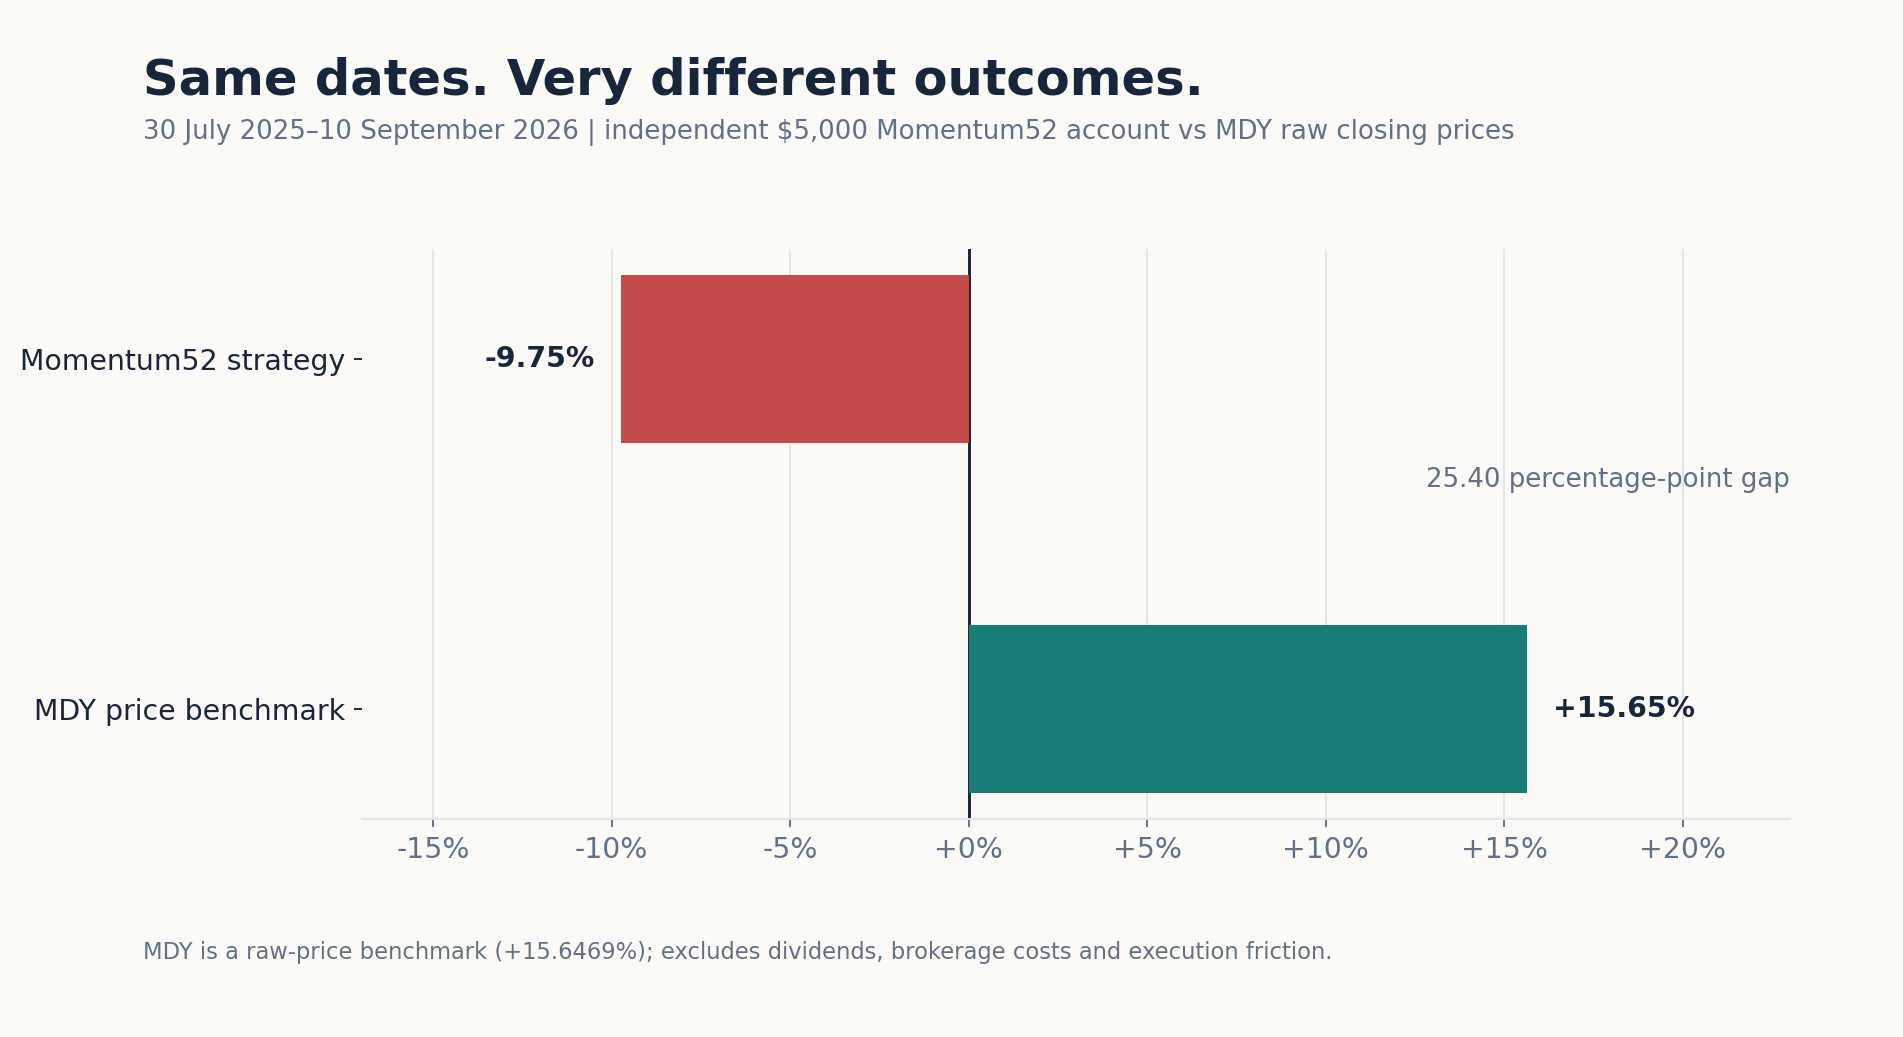
Figure 9. A same-dates benchmark comparison. Momentum52 uses the capital-constrained trading simulation from Post 3; MDY uses the raw closing-price change reported in the original paper. MDY’s bar excludes cash distributions and transaction costs, so it is not a precisely matched brokerage-account comparison. The original paper separately reports an execution-aligned MDY comparator of +14.8886%, also excluding dividends.
This does not prove that every kind of momentum investing fails. It tells us that this particular concentrated, two-stock, long-only Momentum52 implementation failed its historical validation rule and lagged the mid-cap benchmark in the common window.
7. Why might a plausible strategy disappoint?
There is no single cause established by these results, but several practical vulnerabilities help explain why a seemingly logical rule might not produce reliable returns.
Leadership changes. Strong stocks can suddenly stop being strong. A breakout is evidence of an earlier price movement, not a promise about tomorrow.
Crowded entries and late timing. Buying a stock after sustained gains can mean paying a price that already reflects much of the good news. The strategy then buys at the next open, not the more flattering earlier signal-close price.
Concentration and execution risk. With at most two holdings, any one sharp reversal matters. Stops limit intended risk but cannot prevent a loss exceeding the planned level during an overnight gap.
Research and data limitations. The reconstruction uses a fixed 399-stock universe inferred from the original paper’s stock reconciliation, rather than a true point-in-time list of every historical constituent. That leaves potential survivorship and delisting bias. Yahoo Finance historical data and split adjustments can change, and daily candles cannot fully determine the sequence of intraday prices. Those qualifications also apply to a result that happens to look attractive.
Readers who want to inspect the stock universe can download the fixed 399-stock list from Post 3. It is a documented reconstruction of the original paper’s membership, not a point-in-time index history.
The original paper preserved Momentum52’s failure rather than retuning it to produce a better headline. That is an important research decision: revising a rule after looking at the validation period would make that period less useful as an independent test.
8. The wider story: why record unsuccessful strategies?
These posts form two connected pairs:
- Post 1 — Reconstructing a Breakout/Pullback Trading Strategy in Python provides the technical reconstruction of the earlier strategy.
- Post 2 — Can a Breakout Trading Strategy Beat the Market? explains that first strategy in everyday language and candlestick diagrams.
- Post 3 — Momentum52: Reconstructing Medium-Horizon Momentum and 52-Week-High Signals in Python provides the full formulas, historical evidence, executed notebook and frozen stock list for Momentum52.
- Post 4 (this article) translates Post 3 into ordinary language without changing the result.
The broader research sequence is described in my original working paper, From Breakouts and Momentum to Short-Term Reversal: Sequential Strategy Development and Out-of-Sample Validation in U.S. Mid-Cap Equities. It documents what happened when the research moved from breakout/pullback rules to medium-term momentum and later to a different short-term reversal idea. The later strategy is a separate research stage, not evidence that Momentum52 was profitable.
The bottom line
Buying strong stocks near their annual highs is an understandable idea. Momentum52 turned that intuition into a systematic set of checks, ranked entries and planned exits. But the historical results did not support declaring it a successful strategy: the original validation loss was 34.10%, and the predefined acceptance gate failed.
The useful lesson is broader than one strategy: an investment idea should be judged by the evidence it survives, not just by how convincing its story sounds.
For the complete methods, original 399-ticker list, source code and audited trade results, read the technical Momentum52 study in Post 3.
Educational research commentary only. This is not individual investment advice or a recommendation to buy or sell securities. The candlestick illustrations are fictional, while the labelled bar charts report historical research outputs.