Computational Finance · Cenk Ufuk Yildiran · 26 October 2026
Abstract
This study prepares an independent, transparent replication of Momentum52, the second strategy generation in From Breakouts and Momentum to Short-Term Reversal. The model combines intermediate-horizon returns that skip the most recent trading month with 52-week-high proximity, a 55-session breakout filter, benchmark-relative momentum, volume confirmation, and a benchmark trend gate. An independently programmed Jupyter notebook reconstructs the originally governed long-only trading policy and records its own data, signals and portfolio outcomes. It retains the original study dates and the historically failed development/validation rule rather than retrospectively tuning its parameters. In contrast with Post 1, it does not re-download constituent membership from Wikipedia: it uses a frozen reconstruction of the original paper’s 399-member historical universe, while re-downloading stock and MDY price histories through Yahoo Finance.
Executed reconstruction: Using the frozen 399-stock list and independently retrieved Yahoo Finance daily price histories, the full historical run produced 113 trades and −34.2906% portfolio return. The independently funded development and original-validation windows produced 59 trades (+1.4010%) and 54 trades (−34.1037%), respectively; the common comparison window produced 53 trades (−9.7493%). All four summary results match the earlier paper to the displayed precision. These are retrospective reproductions of known historical dates, not a new untouched holdout.
1. Research motivation and evidence
Jegadeesh and Titman (1993) establish medium-term return continuation in diversified winner–loser equity portfolios. Carhart (1997) highlights momentum exposure and trading costs in performance measurement, while Novy-Marx (2012) emphasizes the timing of the intermediate formation window. Momentum52 therefore uses both twelve-minus-one-month and six-minus-one-month return measures, approximated by 252, 126 and 21 trading-session lookbacks. The strategy is not a conventional diversified long–short momentum factor: at most two stocks are held, on the long side, in a $5,000 account.
George and Hwang (2004) provide a research motivation for conditioning on the 52-week high; Lee and Swaminathan (2000) study the relation between trading volume and momentum. Neither literature source establishes the precise 95% high-proximity cutoff, 55-session breakout window, 1.2 volume-ratio filter or weighted percentile score used here. These thresholds are historical project choices, documented and left unchanged.
Finally, Daniel and Moskowitz (2016) identify momentum crash risks, and Sullivan, Timmermann and White (1999) document pitfalls from selecting technical rules after observing historical outcomes. The original Momentum52 research failed its holdout gate; the present reconstruction is not a pretext for revising the strategy after that result.
2. Frozen research universe and independently downloaded prices
Exact research stock list: Download all 399 frozen stock tickers (CSV) · View the membership reconstruction and SHA-256 checksum (JSON). These are the fixed tickers used by the Post 3 notebook, not a live index-membership list. The list was reconstructed from the original-paper reconciliation documented in Post 1; it is not presented as a byte-for-byte copy of the original trading repository’s universe file.
The research population is a frozen 399-stock list inferred from the historical paper’s constituent reconciliation in Post 1, Section 6. That audit identified 393 common constituents, six original-only tickers (CPRI, ILMN, OLN, P, SAM, TWLO) and seven Post-1-only securities (AGNC, CORT, CTVA, EAT, FORM, HUBS, MOG-A). We reconstruct the original membership as the 400 Post-1 manifest tickers minus those seven and plus those six. This is an evidence-based reconstructed membership, not a byte-for-byte copy of the original trading-system universe file. Its CSV file and provenance JSON are SHA-256 checked before signal generation. Future index additions do not change the frozen list.
The notebook downloads historical daily OHLCV from Yahoo Finance via yfinance: 13 September 2021 to 10 September 2026 inclusive, with auto_adjust=False, repair=False, and actions=False. The benchmark is MDY, the S&P MidCap 400 ETF. Its fixed historical reference calendar has 1,254 trading sessions. The notebook records downloaded data fingerprints and fails if a frozen original member has no available Yahoo price history. No replacement ticker is silently introduced.
Historical membership is contemporaneous and projected backwards, not point-in-time membership. This exposes the study to survivorship and delisting bias, and price histories may have been revised since the original paper. Yahoo’s Close is generally split-adjusted even when auto_adjust=False, and should not be confused with a dividend-adjusted total-return series.
3. Mathematical signal specification
Let , , , and be a security’s daily close, high, low, open and volume. The indicator families use only data available at or before the signal-session close.
3.1 Momentum formation windows
The 21-session skip is a deliberate implementation of intermediate-horizon momentum rather than immediate prior-month return continuation.
3.2 Breakout, high proximity and volume
The present high does not enter either trailing high reference; this prevents a current-bar look-ahead in the breakout decision.
3.3 Relative strength and benchmark gate
For observations aligned on common security–MDY dates,
The benchmark regime passes when . A candidate also requires , , , a rising SMA50 over 20 sessions, , , , , , , and . ATR is the arithmetic 14-bar mean of true range.
3.4 Cross-sectional ranking
For the eligible candidates on each signal date, let be the average-tie percentile rank of variable . The governed score is
Scores are rounded to two decimals. Candidates are ordered by score, then raw 126-session relative strength, then raw 12–1 momentum, descending. Ranking is only across eligible names that same day, not the full set of index members.
4. Portfolio implementation
Signals are formed at the session close, with simulated buys on the next trading-session open after five basis points adverse slippage. Starting capital is $5,000, with at most two concurrent positions, two new orders per day, $2,500 per position and $125 planned initial risk per position. A one-dollar commission applies to each buy and sell order. ATR-based initial stops use the signal-date fraction , applied to the executed entry price. After a 10% favorable price move, a 5% trailing stop activates. The maximum holding window is 30 sessions, including the entry session.
The daily-bar engine processes an overnight gap through an active stop before opening new positions, then intraday stop lows before favourable high-based trailing changes. Actual losses may exceed the planned $125 due to overnight gaps and fees. These conventions duplicate the historical project design but do not establish realistic execution in all market states.
5. Historical research chronology and the validation gate
The following archived paper figures were independently reproduced by the executed Post 3 notebook using the same governed membership and a newly downloaded historical Yahoo Finance price dataset. The matching portfolio summary does not, by itself, establish that every transaction and raw OHLCV observation is byte-identical to the archived originals:
| Original segment | Dates | Trades | Historical portfolio return | Profit factor |
|---|---|---|---|---|
| Full historical run | Fixed calendar through 10 Sep 2026 | 113 | −34.2906% | 0.7974 |
| Development | 21 Oct 2022 – 20 Feb 2025 | 59 | +1.4010% | 1.0169 |
| Original holdout | 21 Feb 2025 – 10 Sep 2026 | 54 | −34.1037% | 0.5985 |
| Retrospective common-period comparison | 30 Jul 2025 – 10 Sep 2026 | 53 | −9.7493% | 0.8844 |
The original three-part acceptance rule demanded a development profit factor at least 1.20, a validation profit factor at least 1.20, and positive validation return. It failed. All four archived total-return, trade-count and profit-factor figures were reproduced to the displayed precision. The historical three-part gate still fails; re-evaluating the already-known validation dates is not an independent new holdout.
6. Replication deliverables and limitations
The executed notebook saved the ranked signal calendar, separate trade ledgers and equity curves, download audits, OHLCV fingerprints, portfolio-performance summary, MDY comparison figures and a reproducibility manifest. The download audit reports 399/399 successful stock-price downloads (398 with at least 280 observations and therefore signal-eligible). The signal calendar contains 1,977 ranked signals on 459 dates. The simulator remains offline for trading and creates no broker orders.
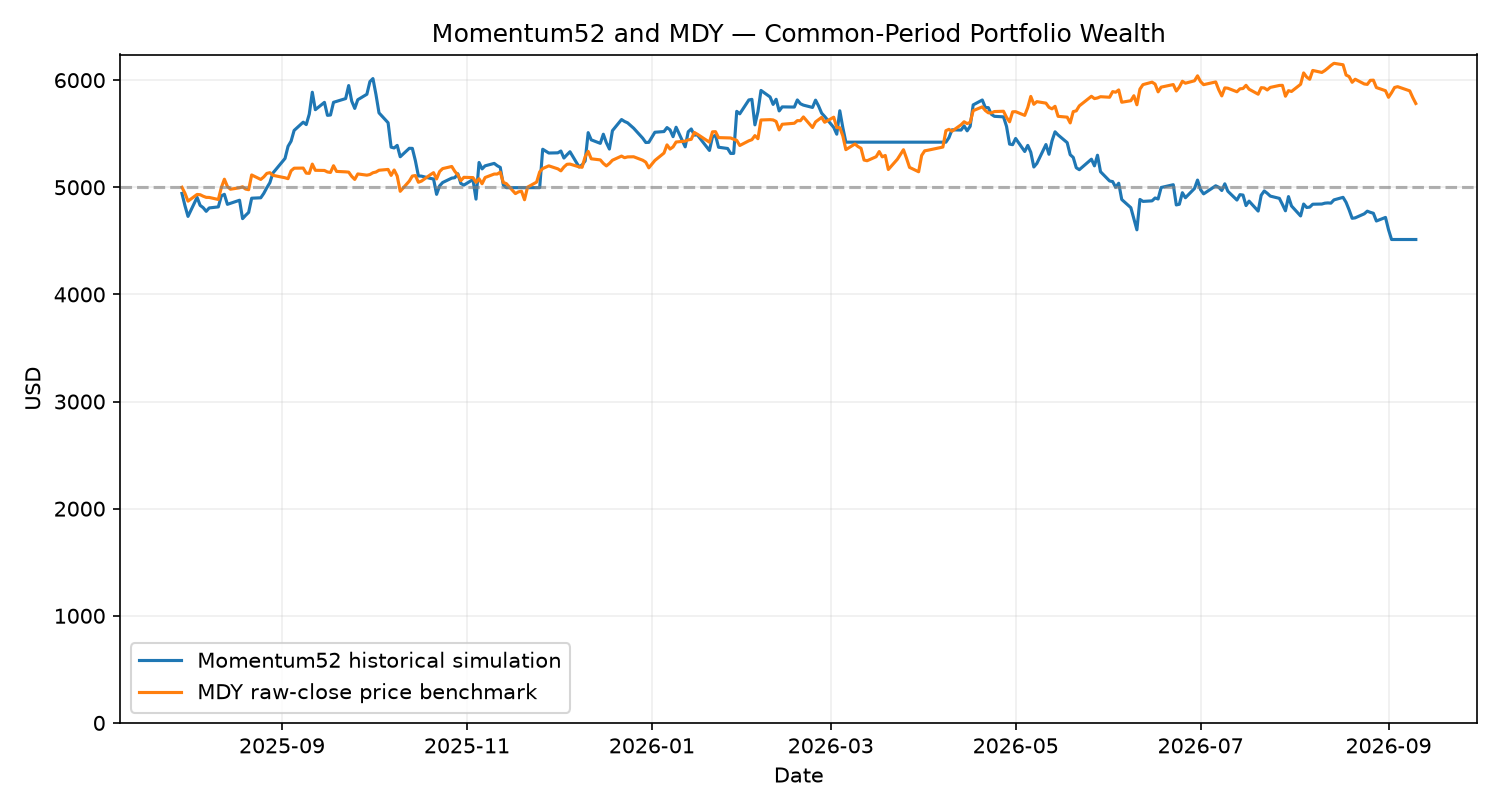
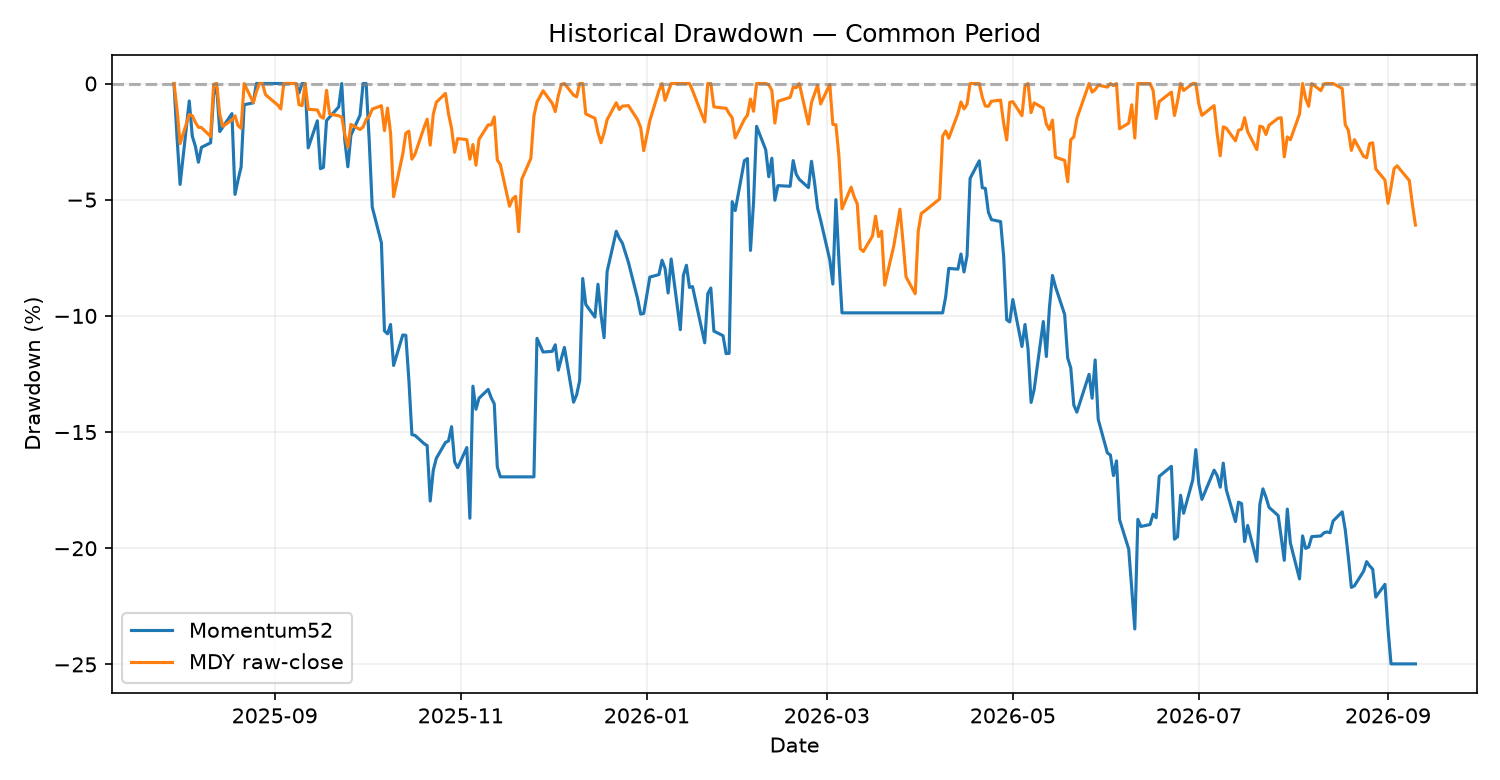
The notebook was executed and its outputs audited; full reproducibility still depends on availability of the historical vendor data, corporate-action conventions and the frozen constituent list.
The most important limitations are (i) reconstructed present-day rather than point-in-time membership, (ii) Yahoo Finance data revisions and possibly unavailable historical symbols, (iii) uncertainty of intraday high–low ordering, (iv) stylized transaction costs, (v) the unusually concentrated two-stock portfolio, and (vi) selection and holdout contamination inherited from earlier strategy development.
Research downloads: Jupyter notebook · Python requirements · Frozen 399-ticker universe · Universe provenance and hash.
References
- Carhart, M. M. (1997). On Persistence in Mutual Fund Performance. The Journal of Finance, 52(1), 57–82. https://doi.org/10.1111/j.1540-6261.1997.tb03808.x
- Daniel, K., and Moskowitz, T. J. (2016). Momentum Crashes. Journal of Financial Economics, 122(2), 221–247. https://doi.org/10.1016/j.jfineco.2015.12.002
- George, T. J., and Hwang, C.-Y. (2004). The 52-Week High and Momentum Investing. The Journal of Finance, 59(5), 2145–2176. https://doi.org/10.1111/j.1540-6261.2004.00695.x
- Jegadeesh, N., and Titman, S. (1993). Returns to Buying Winners and Selling Losers: Implications for Stock Market Efficiency. The Journal of Finance, 48(1), 65–91. https://doi.org/10.1111/j.1540-6261.1993.tb04702.x
- Lee, C. M. C., and Swaminathan, B. (2000). Price Momentum and Trading Volume. The Journal of Finance, 55(5), 2017–2069. https://doi.org/10.1111/0022-1082.00280
- Novy-Marx, R. (2012). Is Momentum Really Momentum? Journal of Financial Economics, 103(3), 429–453. https://doi.org/10.1016/j.jfineco.2011.05.003
- Sullivan, R., Timmermann, A., and White, H. (1999). Data-Snooping, Technical Trading Rule Performance, and the Bootstrap. The Journal of Finance, 54(5), 1647–1691. https://doi.org/10.1111/0022-1082.00163
- White, H. (2000). A Reality Check for Data Snooping. Econometrica, 68(5), 1097–1126. https://doi.org/10.1111/1468-0262.00152
- Yildiran, C. U. (2026). From Breakouts and Momentum to Short-Term Reversal. SSRN working paper 7636019. https://papers.ssrn.com/sol3/papers.cfm?abstract_id=7636019