Trading strategies explained · Cenk Ufuk Yildiran · 23 October 2026
Buying a stock because its price is rising can sound reckless. Buying one because its price has fallen can sound sensible. Yet investors often do both, sometimes as part of a carefully designed trading system. So which approach actually works?
To explore that question, I built a Python backtest that follows two simple ideas: buy a breakout when a strong stock pushes past a recent high, or buy a pullback when a rising stock briefly returns towards its usual price trend. The system also decides when not to buy, how much to invest and when to sell. The results offer a useful warning: a trading strategy can sound logical and still lose money.
This article is a plain-English companion to Post-1, the full technical analysis. You do not need to know Python, statistics or chart analysis to follow it.
1. What is a breakout trading strategy?
Imagine a stock has spent several weeks trading below $100. Then one evening it closes at $102, above the highest price reached during the previous 20 trading sessions. That is the basic idea of a breakout: buyers have pushed through a recent price ceiling.
But a new high on its own was not enough for this backtest. The stock also needed trading volume at least 20% above its recent 20-session average. The idea is to look for a strong move that attracts noticeable trading activity, rather than a quiet price drift.
A pullback takes the opposite route to a possible entry. Instead of chasing a new high, the strategy looks for an already-rising stock whose price has moved back near its 20-session moving average—a rolling average of its recent closing prices. The stock must close within 2% of that average, stay above its 50-session average and finish the day at or above its opening price. If the stock qualifies as a breakout, the strategy labels it a breakout first.
Both approaches try to participate in an existing upward trend. The difference is the timing: breakout buyers seek strength at a new high; pullback buyers seek a temporary pause in that strength. Neither rule is a guarantee that prices will rise next.
What does a breakout entry look like?
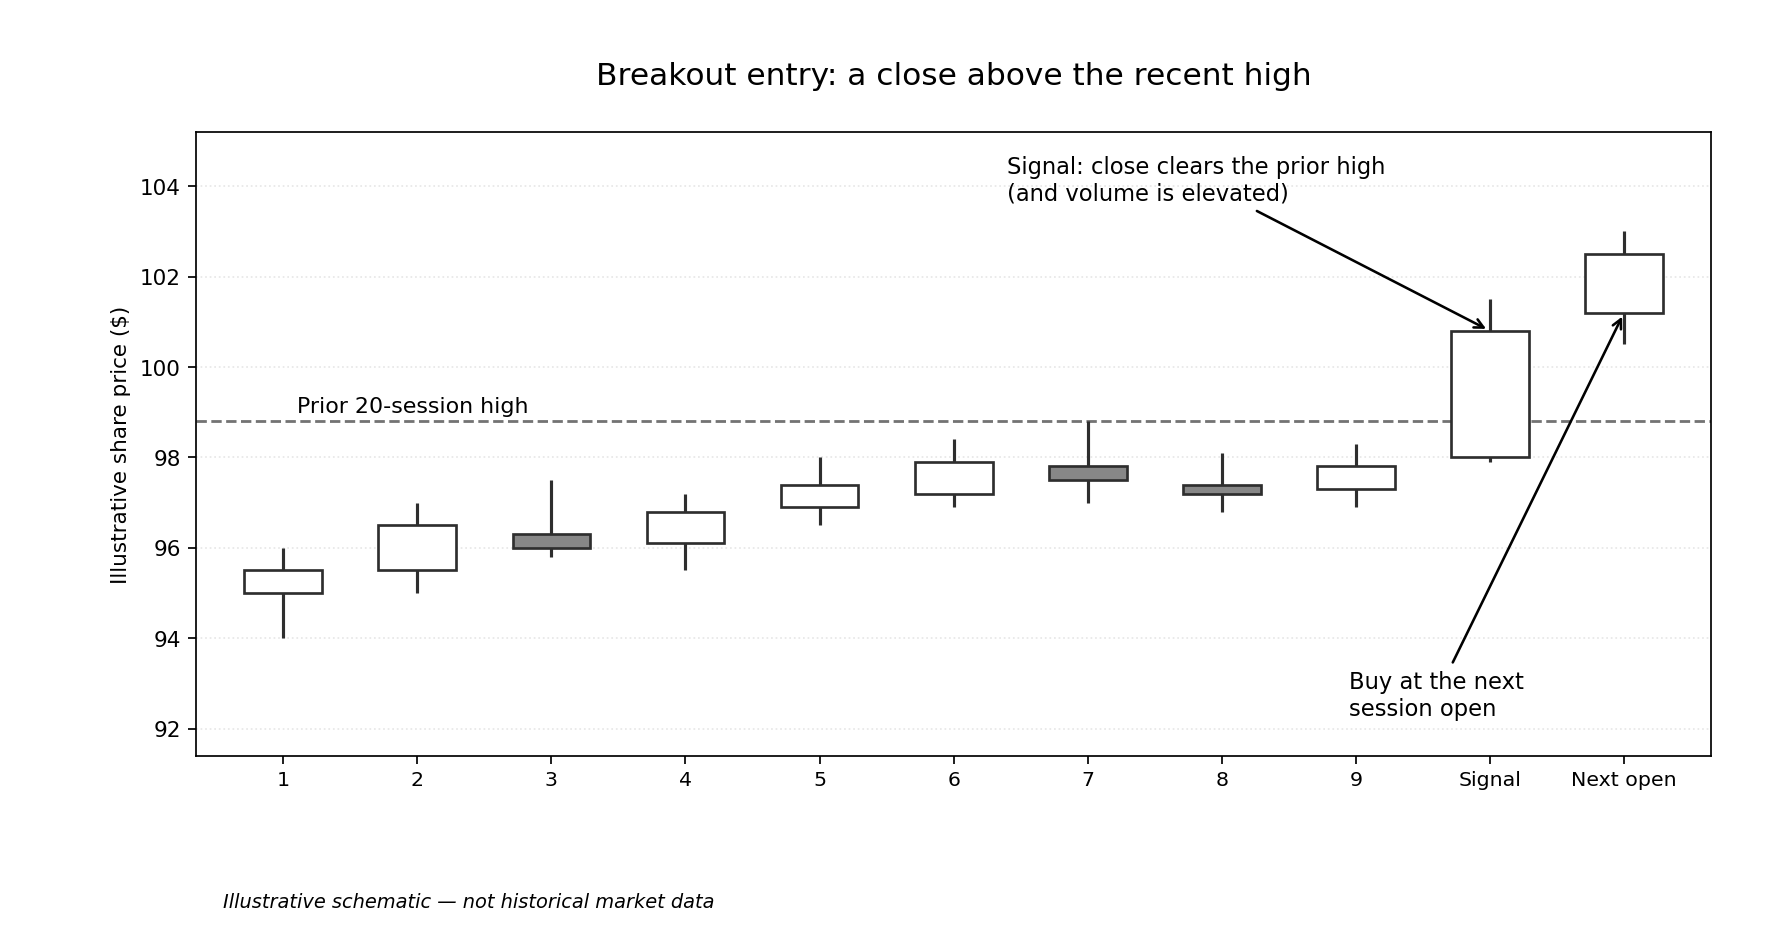
Figure 1. Illustrative breakout setup. A stock spends several sessions below a recent ceiling, then closes above it on stronger-than-usual trading activity. In this strategy the purchase happens at the next day’s open, not at the close of the breakout candle. This is an explanatory diagram, not a historical trade from the backtest.
What does a pullback entry look like?
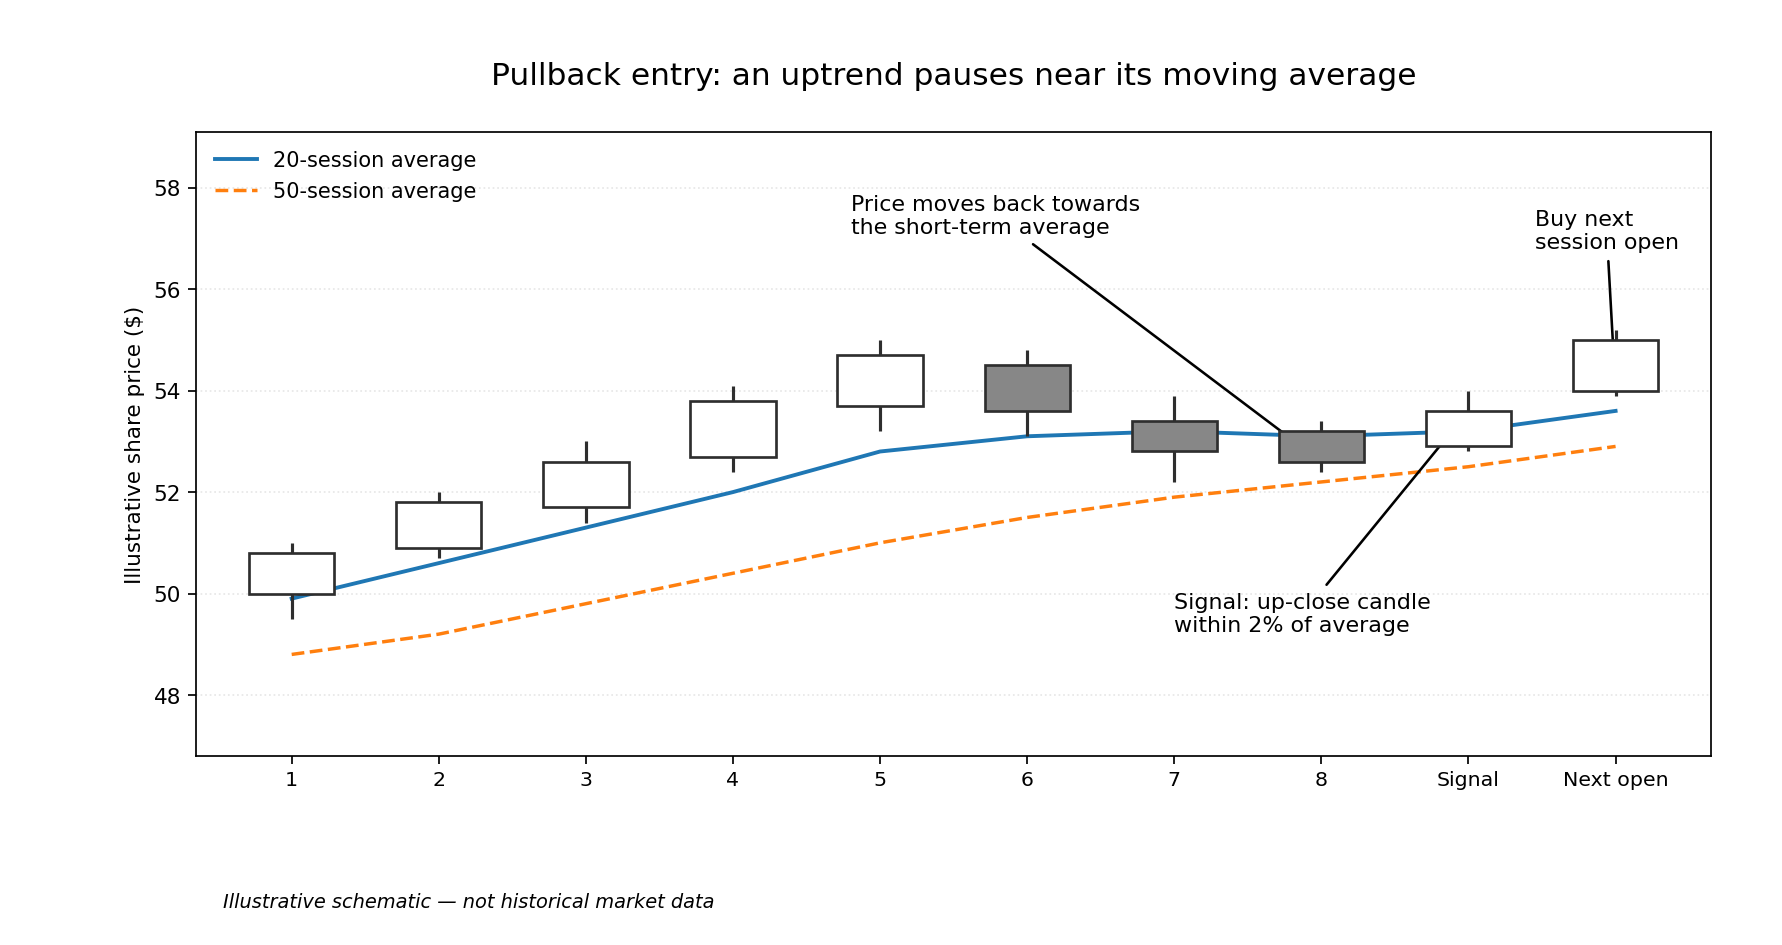
Figure 2. Illustrative pullback setup. The stock remains in an uptrend, drifts back towards its 20-session moving average and then stabilises. In the backtest, the stock also had to remain above its 50-session moving average and close at or above the day’s open. This is an explanatory diagram, not a historical trade from the backtest.
2. The rules before the buy: not every stock qualifies
Before considering either entry, the system checks whether the stock—and the broader market—look suitable:
- Price and liquidity: the stock must cost at least $10, with average daily trading value of at least $5 million. Liquidity matters because a theoretical price is not always a practical trading price.
- Upward trend: its closing price must be above its 50-session moving average, which must itself be above the 200-session average. The 50-session average also needs to be rising.
- Relative strength: over the preceding 63 sessions, the stock must have performed at least as well as MDY, the exchange-traded fund used here as a U.S. mid-cap benchmark.
- Market conditions: MDY must also be in an uptrend: its close above its 50-session average, and that average above its 200-session average.
Only then does the strategy test the breakout or pullback rule. Think of this as two gates: first, is the stock eligible? Second, is there a reason to buy today?
Which buy setup appeared more often?
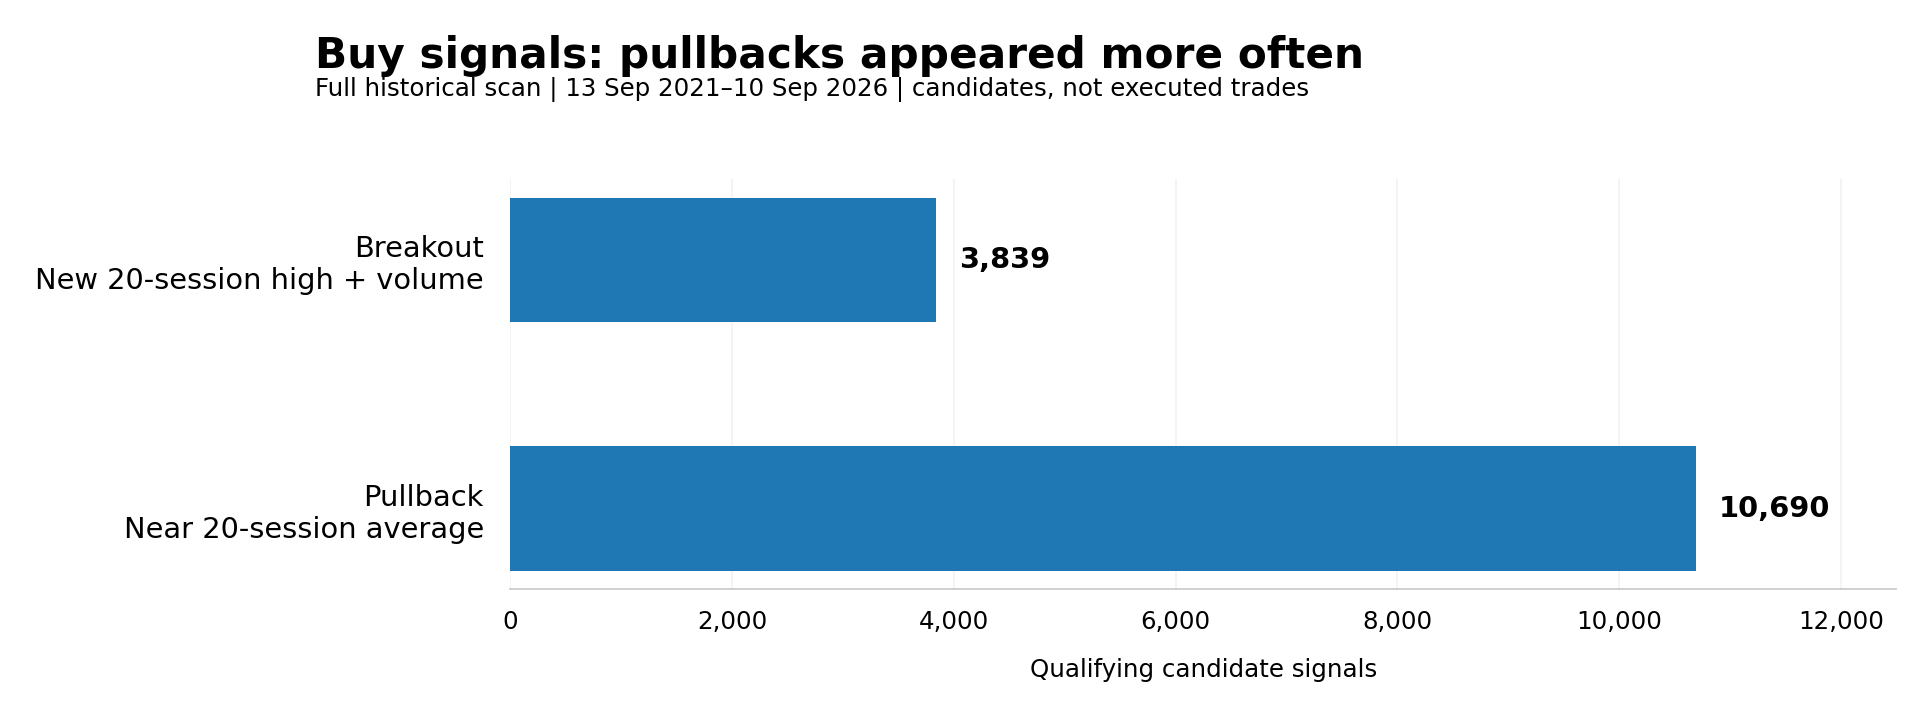
Figure 3. Candidate signals identified across the full historical scan, 13 September 2021–10 September 2026. Breakouts required a new 20-session high with elevated volume; pullbacks required a return near the 20-session average. These are qualifying signals, not executed trades. Source: Post-1.
The system found 3,839 breakout candidates and 10,690 pullback candidates—14,529 in total. Pullbacks were much more common. But a signal appearing frequently says nothing by itself about whether it is profitable: the portfolio could only take a small number of trades.
3. When does the strategy actually buy?
The rules are checked after a trading session closes. If a stock qualifies on Monday evening, the strategy can only buy at Tuesday’s opening price—not retroactively at Monday’s close.
When several stocks qualify, the program assigns them scores based on trend, volume, relative strength and setup type. It buys higher-ranked candidates first, if there is sufficient cash and an available position slot. A score of 100 is a ranking score, not a 100% probability of success.
The simulation starts with $5,000, permits at most two open stock positions, and caps the planned amount in each position at $2,500. It also accounts for $1 commission per buy or sell order and a small adverse fill adjustment of 0.05% on each side of a trade. These details matter: a convincing chart pattern is not the same thing as a trade you could have executed at the earlier closing price.
4. When does it sell? Stop-loss, trailing stop and time limit
A complete trading strategy needs an exit plan. This one has three main types of sell rule:
Initial stop-loss. When a stock is purchased, the system places a modelled exit level below the entry. The distance varies with recent price volatility, within a 4%–8% range in the normal case. Position sizing targets up to $125 of planned price risk, subject to the $2,500 position cap and available cash.
Trailing stop. If the stock’s trading-session high reaches 10% above the entry price, a trailing stop becomes active at 5% below the highest observed price. This is designed to protect part of a large advance while allowing some room for normal fluctuations. In the daily-bar simulation, a newly raised trailing stop is not applied backwards to an earlier low on that same day.
Time limit. If a position has not exited through a stop, the system closes it after 30 processed holding bars. That is a backtest-specific counting rule, not 30 calendar days; any open positions are also closed at the final research date.
What do the stop-loss and trailing-stop rules look like?
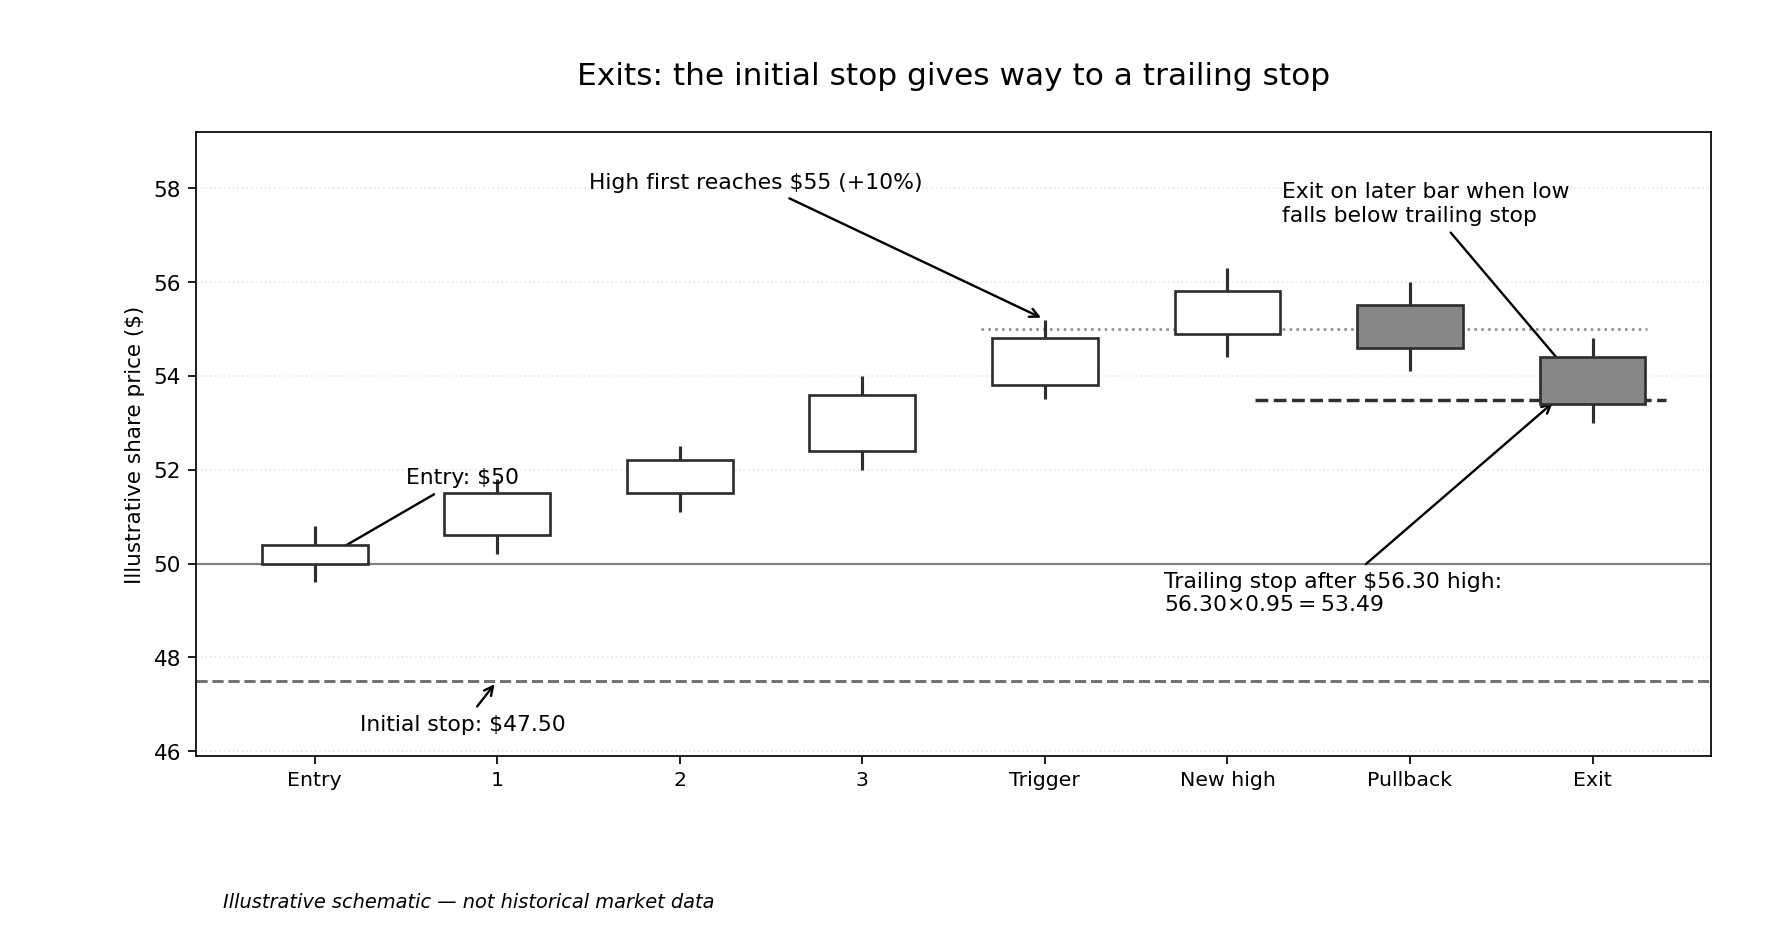
Figure 4. Illustrative exit logic for a winning trade. The position starts with an initial stop-loss. After the price reaches 10% above entry, a trailing stop activates at 5% below the highest observed price. This is an explanatory diagram, not a historical trade from the backtest.
An illustrative $50 trade
Suppose a stock is bought at $50, and the volatility-based initial stop works out to 5%. Its initial stop would be around $47.50. If a later session reaches $55—10% above entry—the trailing rule can activate. A stop 5% below that $55 high would be $52.25, potentially protecting a gain if prices subsequently fall. These prices are a made-up teaching example, not a transaction from the historical results. Real fills can be worse than the stated stop levels, especially after overnight gaps.
This is the difference between a sell rule and a promise: the computer can specify when it wants to exit, but the market determines the price available.
5. Did the breakout strategy beat the market?
To make the results easier to interpret, focus first on one independently funded historical test: 30 July 2025–10 September 2026. The strategy started with $5,000, closed 60 trades, and ended with $4,251.89, a loss of 14.96%. Over the same dates, $5,000 tracked against the raw closing prices of MDY would have grown to about $5,782.35, a gain of 15.65%. That comparison excludes MDY distributions and trading costs, so it is not a like-for-like investor account statement.
There is also a longer, separately funded simulation covering 13 September 2021–10 September 2026. It closed 130 trades and ended with $2,530.12 from $5,000, a loss of 49.40%. The two portfolios start with fresh $5,000 balances; the shorter result is not simply the final slice of the longer account.
Which type of trade won more often?
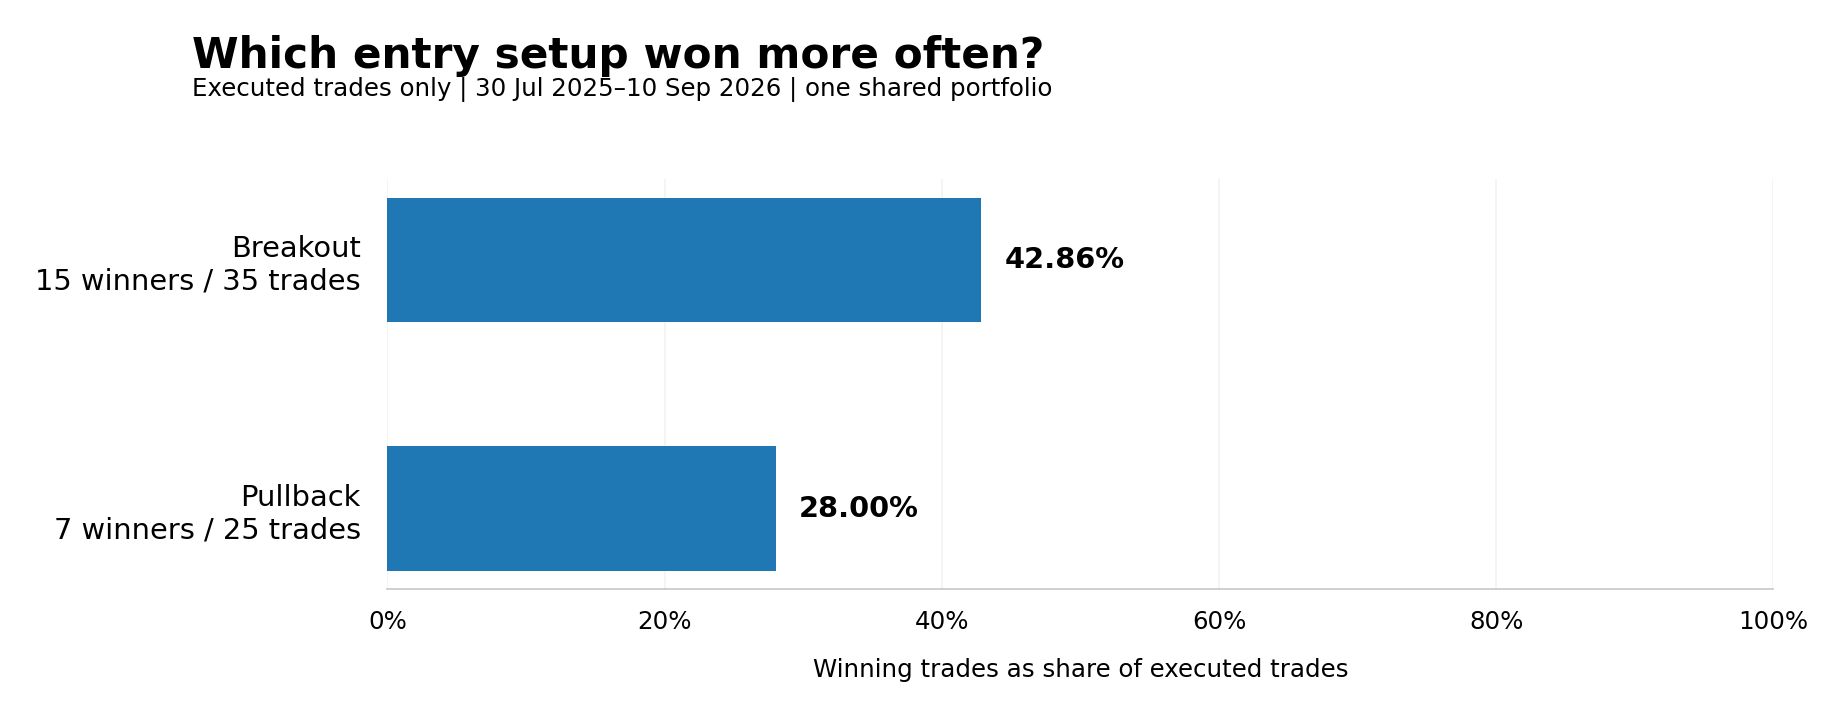
Figure 5. Win rate among trades actually executed in the independently funded 30 July 2025–10 September 2026 portfolio: 15 winning breakouts among 35 breakout trades and 7 winning pullbacks among 25 pullback trades. Winning less than half the time does not automatically imply a losing strategy; the size of wins and losses matters too. Source: Post-1.
Breakout trades won 42.86% of the time, against 28.00% for pullbacks. Both setups had more losing trades than winning trades, but breakout trades were more likely to finish in profit. Importantly, those are outcomes for the positions the strategy actually opened, not for all 14,529 candidate signals in Figure 3.
Which type of trade made or lost more money?
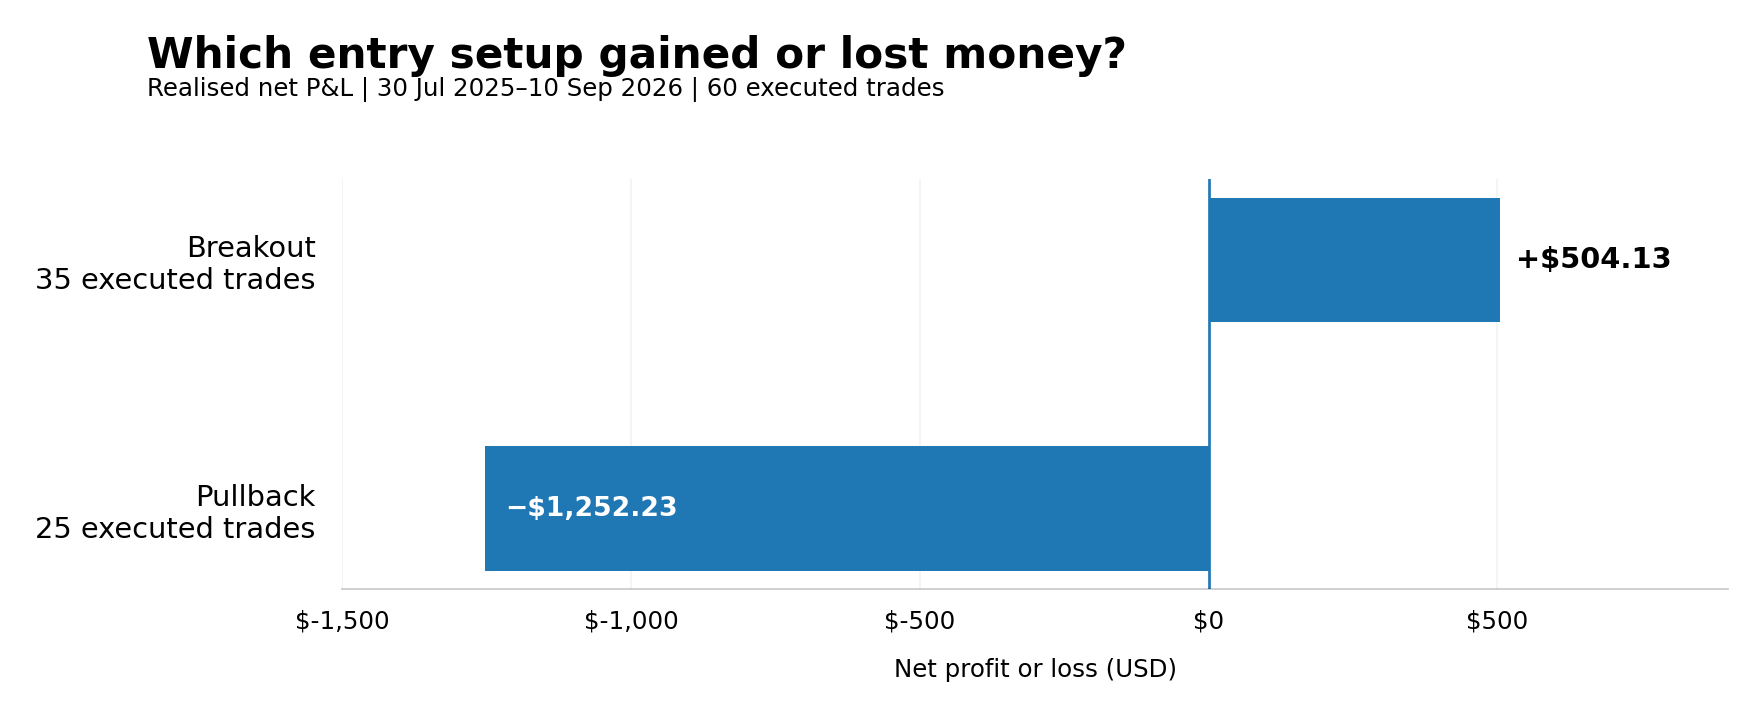
Figure 6. Total realised net profit and loss by entry setup in the shorter portfolio. Breakouts added $504.13; pullbacks lost $1,252.23. These trades shared one portfolio and its capital constraints; the bars do not represent two independently funded trading accounts. The combined loss is approximately $748.11 after rounding. Source: Post-1.
The positive result from breakout entries could not offset the heavier losses from pullback entries. Even the breakout gains depended significantly on a handful of unusually successful trades. That is why a better win rate alone is not proof of a reliable edge.
6. Why a stop-loss does not guarantee a small loss
Imagine setting a stop at $47.50 on a $50 stock. If troubling news arrives after the market closes, the next opening trade might occur at $44. The price can jump past your planned exit level without ever offering a trade at $47.50.
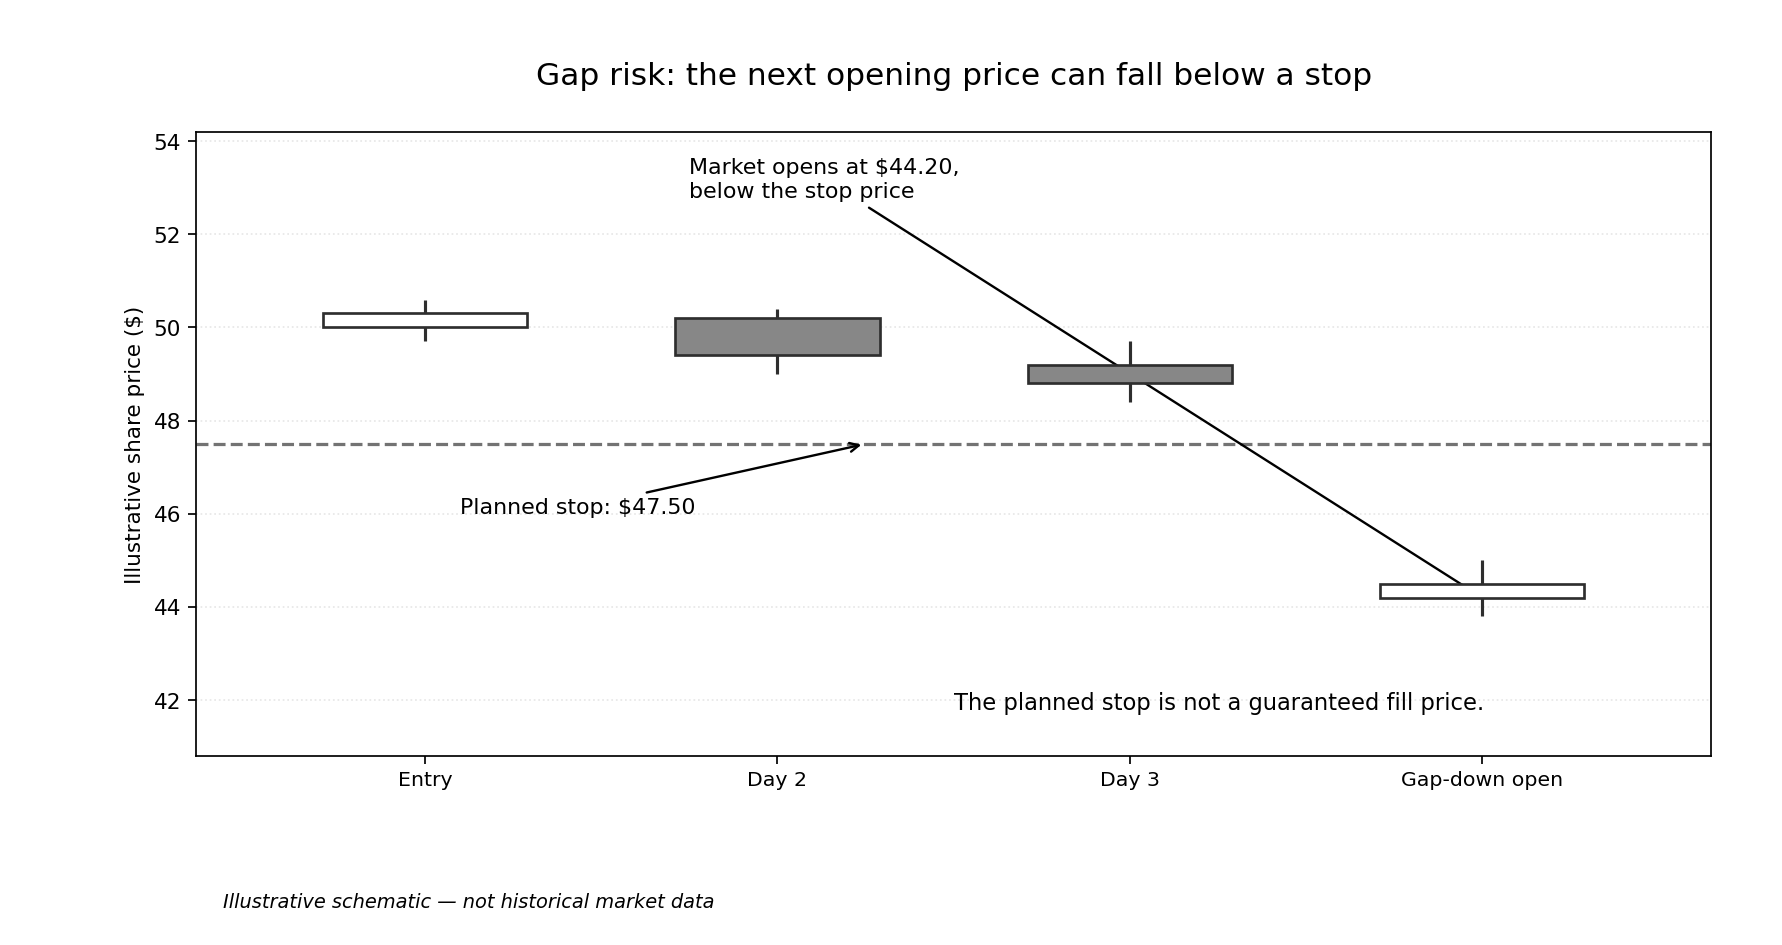
Figure 7. Illustrative gap-down exit. The strategy may want to sell at a chosen stop price, but overnight news can push the next opening trade below that level. This is why realised losses can exceed the initially planned price risk. This is an explanatory diagram, not a historical trade from the backtest.
The backtest illustrates this problem. Seven opening gap-through-stop exits produced about $1,350.97 in combined losses, with average realised losses 1.63 times the initially planned price risk. Even a strategy that defines its maximum intended exposure cannot guarantee its maximum realised loss.
This is also why trading costs and execution timing belong inside a backtest. A strategy that looks attractive before commissions, slippage, gaps and cash constraints may look quite different after them.
7. What should beginners take away?
A trading signal is only one ingredient. Whether a breakout or pullback is worth taking also depends on trend filters, market conditions, candidate rankings and capital availability.
More opportunities do not mean better opportunities. Pullbacks generated far more candidate signals, yet the executed pullbacks performed worse in this particular historical test.
Selling is as important as buying. Initial stops, trailing exits and holding limits shaped the final outcome. They helped define a disciplined process but did not prevent a loss.
Historical results are evidence, not guarantees. This analysis used a present-day snapshot of index constituents applied retrospectively. That can introduce survivorship bias. Historical market data may be revised, and daily price bars cannot reveal the exact sequence of intraday trades. The test is retrospective, not a live demonstration of future returns.
The bottom line: simple trading rules are not simple profits
Buying strength after a breakout and buying a dip within an uptrend are understandable ideas. So are stop-losses, position limits and following the broader market. But when these ideas were combined into a specific rule-based system and tested with real execution constraints, the strategy did not beat the benchmark over the shorter comparison window and lost money in the longer historical run too.
That does not settle whether breakout or pullback trading can ever work. It shows why a promising-sounding rule needs transparent testing rather than confident marketing claims.
For the exact formulas, implementation details, data assumptions and downloadable Python notebook, read Post-1: Reconstructing a Breakout/Pullback Trading Strategy in Python.
Educational research commentary only. This article is not individual investment advice or a recommendation to buy or sell any security.